
Financial markets constantly anticipate events, both on the positive and on the negative side, which fail to materialize exactly because they have been anticipated
Experienced market watchers understand the significant impact that understanding boom-bust cycles can have on returns. As Warren Buffett wisely said, one should be ‘greedy when everyone is fearful’. However, as Soros astutely pointed out, investors often shape reality. The example of early 2009, when most investors were sellers despite it being the best buying opportunity in 50 years, is a stark reminder of the influence of human nature on investment decisions. This behavior, while not surprising, is a testament to our tendency to follow the crowd for a sense of security. It is a thought-provoking insight into our decision-making process, one that we should consider when making market decisions, and why we are wary of joining the end of long lines.
In the 1920s, a boom cycle was evident, and its symbol was RCA, the Radio Corporation of America. RCA held the patents for manufacturing and distributing radios, creating radio stations, and eventually established NBC. The innovation of radio was revolutionizing the world and dominating conversations. The Chairman of GE in 1929 remarked, “It has helped to create a vast new audience of the magnitude what was never dreamed of…this audience…differs not only in size but in kind from any audience the world has ever known.” The stock of RCA surged by 200X in the 1920s, as sales grew by more than 10X and profits by 7X from 1922 to 1928, a testament to the power of innovation in driving market trends.
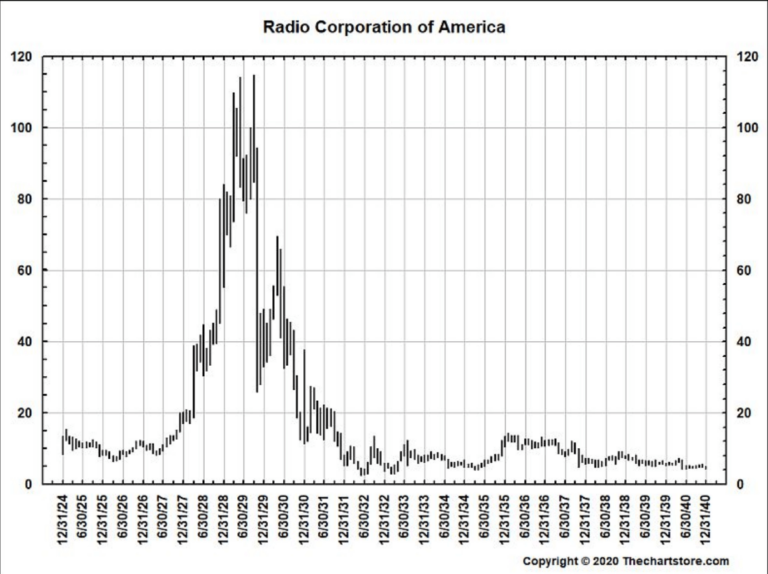

Long line #1. NVDA?
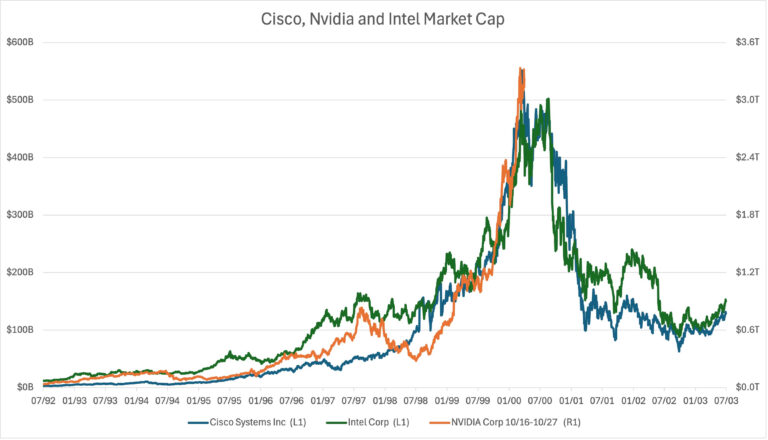
The RCA story has some analogs in the last few decades: Intel in the 1990s, which owned the risk architecture and defined the PC age; Cisco, which controlled the fastest routers in the late 1990s, and the world demanded only their faster routers.
In the late 90s, every tech stock idea was compared against the relative strength of those two names, and in general, it was hard to ever bet against these stocks until something changed. Intel’s glide path from incredible to pedestrian was slow as their core technology became less critical. Cisco’s was more abrupt. The move to edge servers to sending out packets of 1’s and 0’s meant their powerful routers were less needed in the early 2000s compared to the rabid demand in the late 90’s, where internet growth was not possible without their powerful core routers.

This, of course, leads us to comparisons with NVDA. The company’s performance has been nothing short of absolutely amazing. While RCA’s share price was up 200X, NVDA is now up 260X over the last 10 years as sales have grown 15X and profits by 68X. It has a definitive technology advantage, a rare growth trajectory, and pricing power. As Soros predicted in his book; it has caught the creative curiosity of market participants.
We recently wrote about AI here and are left to marvel at Nvidia
Through the end of Q2, NVDA’s stock performance represents one-third of the SP500’s investment returns, and the SP500’s market cap is $45 trillion. The rest of the Mag 7 represented about 20% of the SP500’s return YTD, so it is not the Magnificent 7; it is the Magnificent 1.
The market cap of the entire R2000 is only $3 trillion; in the last year, NVDA’s market capitalization has increased by about $2 trillion. The point here is that no matter how big of an idea you think NVDA is, at least in the market’s eyes YTD, it is an even bigger idea than you think!
We are reminded of Barton Biggs’s words that “[t]here is no investment idea that is so fantastic that it cannot be spoiled by too much capital.” Bernie Ebbers made this concept come to life. He said in 2002, after it was clear that we had built enough fiber optics for the next decade or so, “We have a lot of capacity out there that is not being used, and that’s a problem for the industry.” Interestingly, demand for telecom kept growing despite his comments; the issue was the capital markets just funded too much capacity, just as Barton predicted and Soros remarked.
With hindsight, Intel, Cisco, and RCA became fantastic companies, employing thousands of people. However, their stock prices never recovered, and their stocks performed poorly for years after their peak.
Will this happen to Nvidia? Probably? When will it happen? It is anyone’s guess.

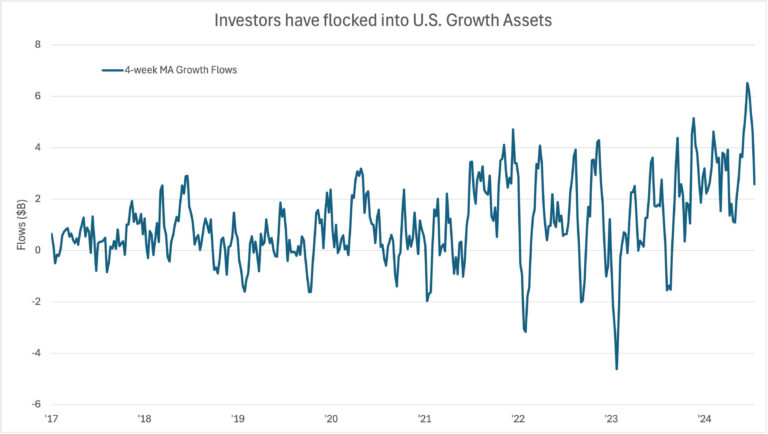
Long Line #2. US Large-cap Growth
Continuing tech and flows, the flows into the story, or rather the line forming outside of the “large-cap growth restaurant,” have increased. This is predictable and not really predictive of future returns, but it is something to consider. Below are the flows into US larger-cap growth funds through the quarter end.
The good news for the market participants is that the fundamental performance has followed their run-up, and except for a few software stocks, the earnings and fundamentals of US Tech companies have been exceptional. The market has taken notice as US tech companies now trade for double the P/E ratio of the rest of the world. The only time the extreme was this large was in 2000. Until 1998, tech companies in the US sold at a discount to global tech companies, while European and Japanese companies in gaming and cell phone technology dominated the world stage.
The market is narrow and led by a few stocks.
A lot of press has been about market divergence; through June 30, this market has had the least breadth of any market in the last 50 years. Said another way, buy NVDA! With the solid and lower CPI and a possible shift to a Trump presidency, recently, the market has rewarded smaller companies. The breadth of the market, typically a signal of the health of the broader market, is still relatively weak, signaling to us that the broader U.S. market is still worried about the impact of higher rates and a slowing economy, even if the few stocks at the top of the market don’t seem to notice.
What is the economy doing?
It is slowing, and we can find this in every data source. The most straight forward formula in economic forecasting is the macroeconomic identity for Gross Domestic Product.
GDP = Consumption + Investment + Government +/- Net Exports.
For simplicity, let us ignore net exports, as they tend to be relatively steady.
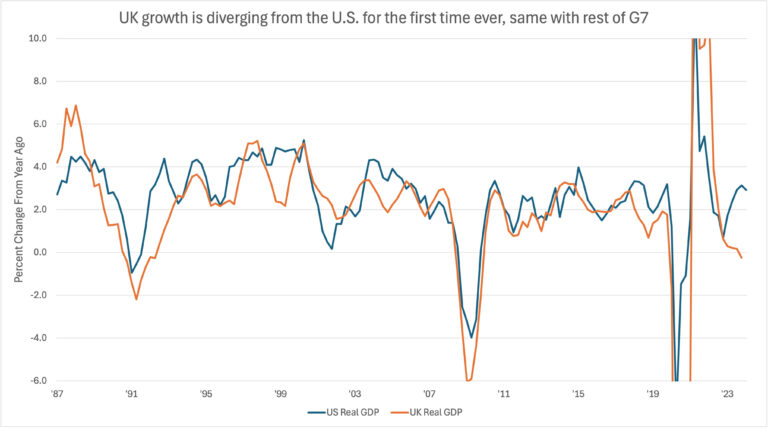
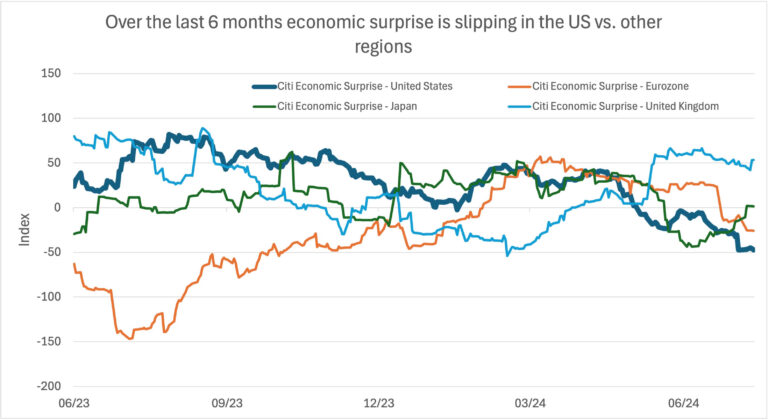
The first observation we have, and others have, is that the government is spending more; this is not typical during economic expansion; we are, in some ways, outliers from the rest of the world (politics aside, the Republicans also spent during a strong economy). Shown below is the GDP of the US vs. one of the more similar countries, the UK; you can see the strong correlation for decades and the wide divergence recently; most of this is caused by, we believe, the robust fiscal spending with a bit of US exceptionalism (see last quarters report).
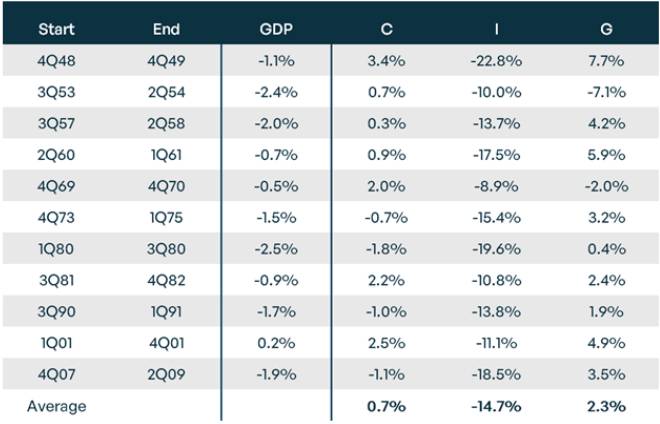
Below are the last few recessions and the change in these GDP factors. What jumps out is that consumption, counter to popular belief, generally doesn’t decline but slows. Capital spending always decreases, which makes sense as corporations’ most straightforward way to conserve cash or manage excess capacity is to throttle excess capital spending. And then, not surprisingly, the government accelerates its spending to stabilize the economy. The chart below does an excellent job summarizing that (note we have removed the COVID recession as it did not fit the mold of a typical demand-led downturn we have seen over the last 75 years).
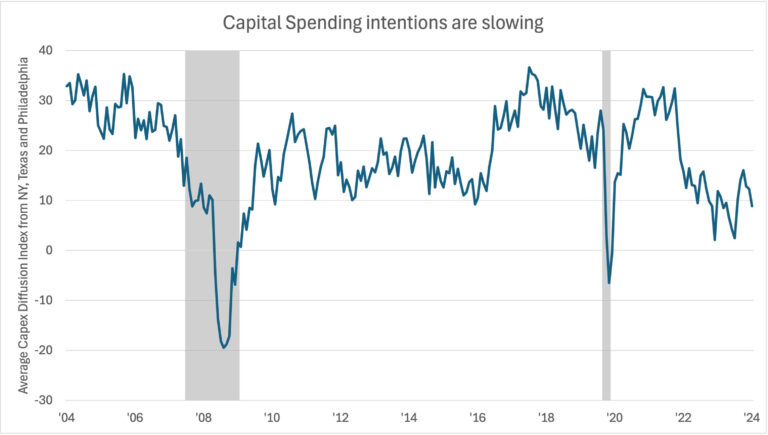
Looking at this data, the logical question might be, what is happening to capital spending today? The answer is not good and consistent with the initial stages of an economic slowdown. Shown next is capital spending intentions from US corporations.
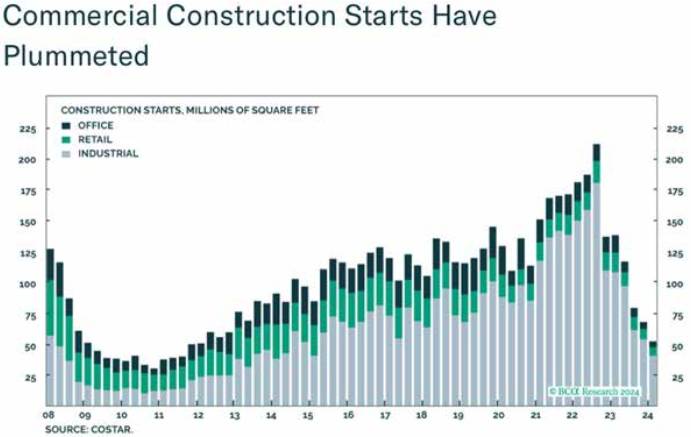
Commercial construction starts, shown below, typically leads actual construction by 6 to 9 months, so we should expect more slow down at least from construction in the future.
Housing is another critical barometer. In May, Zonda surveyed builders across the US about their feelings about demand. In Florida and Texas, the two biggest boom states of the past decade or two, over two-thirds commented that demand was worse than expected and only 4% better.
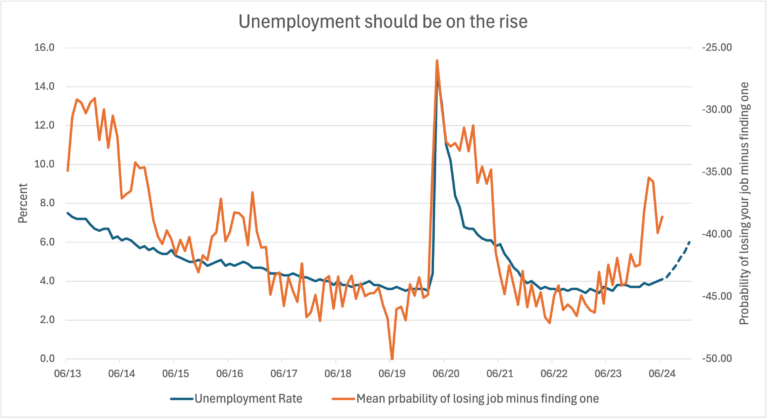
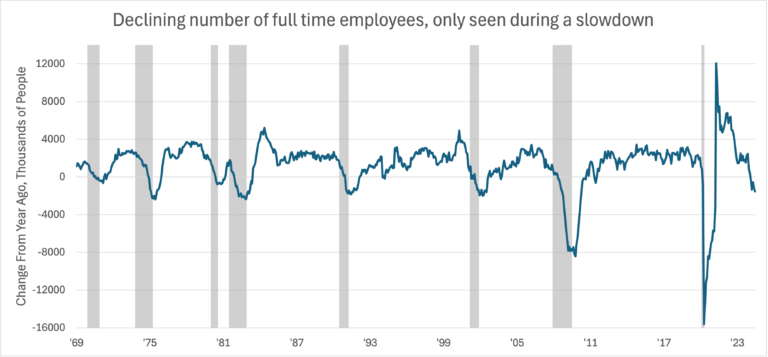
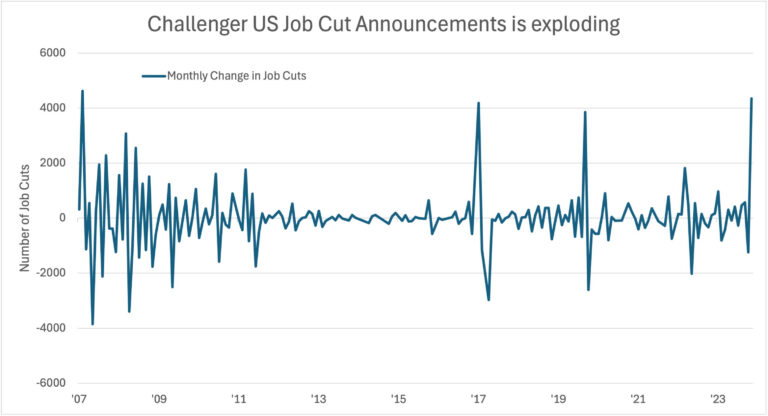
Next are a few charts that indicate what is happening in the labor market and with the jobs market. The summary is strong today but slowing.
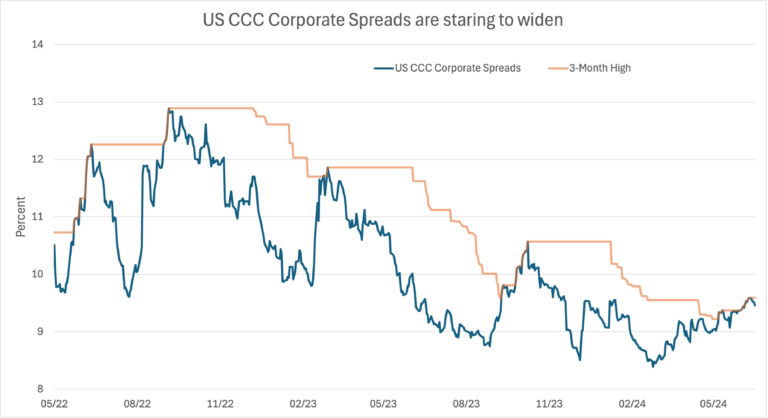
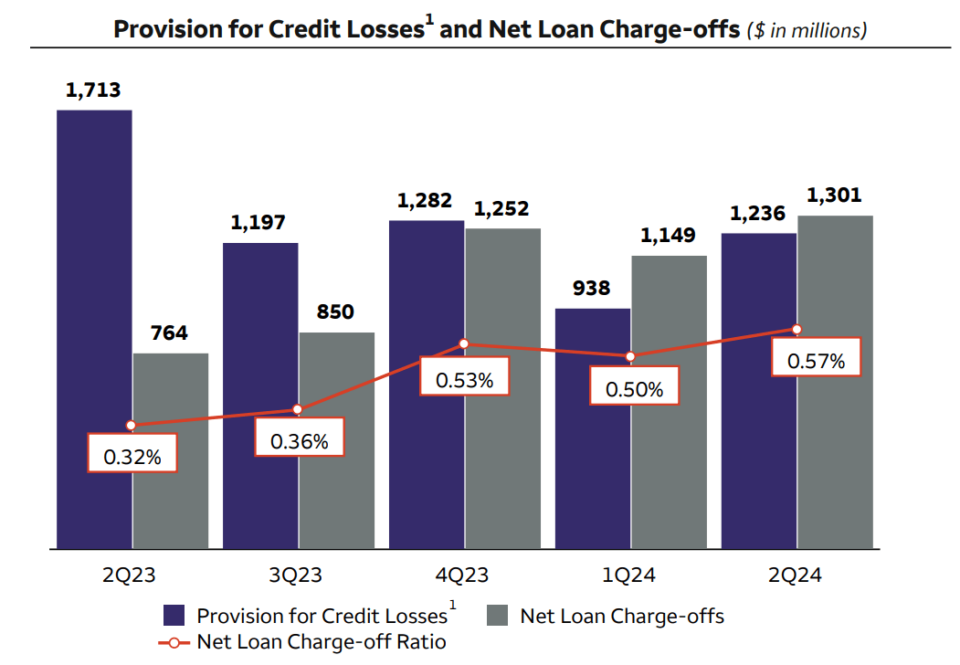
In previous musings, we have expressed caution about credit as most credit was priced for perfection; we have been wrong as perfection has lasted longer than we anticipated; however, the recent data shown in CCC spreads and recent earnings from Wells Fargo point to continued escalation in non-performers seems to point to worse credit performance in the future.

What is the Fed to do?
We and the market are sure that the Fed will cut rates in September; we wrote about this last quarter. With the economy slowing and inflation calm, J POW has room to claim victory.
The market has taken all this softening as essentially “good news,” and this gives the Fed less room to stimulate. The odds of Trump winning the election have spurred speculation that more corporate-friendly policies will be followed. The U.S. Central Bank’s issues are very subtle and are ones they have not encountered in the past; the market reflexively discounts its hand before it is played. As an example, the R2000 market’s 50-day moving average is now four standard deviations over trend, a level not seen in any market going back to 1900. This complicates the Fed’s ability to slow the economy or inflation as the market has effectively front-run all their bluffs of being tough on growth; the market knows the Fed’s tell.
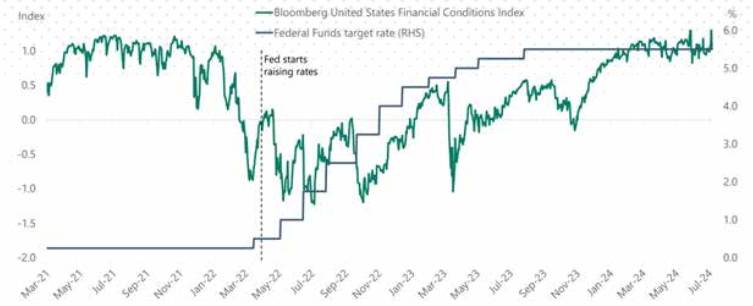
Below is a clever chart from Torsten Slok at Apollo, showing the Fed Funds rate overlayed against the financial conditions index from Bloomberg. It is not exactly apples with apples, but it tells the story that the market had front-run the Fed’s moves. The financial condition index is a composite weighting of risk measures, such as VIX, TED spread, and the move in the SPX, all indexed against a baseline. Narrow spreads, low volatility, and an upmarket give a higher level. So, despite rates moving dramatically, other things have happened in the economy and through government influence that gives the sense of easy financial conditions despite much higher short-term rates. It appears with perfect hindsight that the deep drawdown in equity and bond markets during the first nine months of 2023 was the market discounting the increase in Fed rates a year in advance. This is the definition of Soros’s reflexivity!
So, in response to the apparent slower economic data presented above:
Will the Fed cut rates this quarter? YES.
Does that mean the market already knows this? Likely.
Should the market expect strong returns in response to a Fed cut? No. Interestingly, most periods of rate cutting have been met with weaker markets, not stronger.
Everything is going so well; should we be worried?
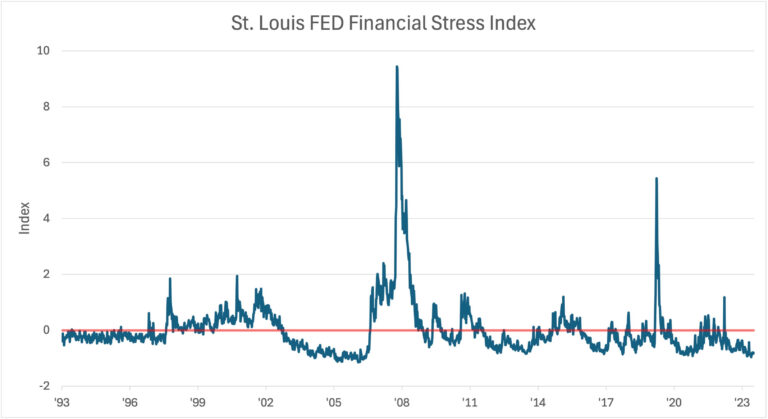
Anyone with children knows that even when things are going well, it can turn bad quickly. With that analogy, let us start with this chart: No one is worried, and we should be worried is the message. This is a composite measure of complacency measured using various economic data; the St. Louis Fed designed it post the 2008 crisis to measure stress in the system as dictated by the capital markets; today, the read is clear, we have the lowest financial stress since late 2007.
This gives us reason to pause. If you want to be worried, we would worry about the correlation of stocks and if the controlled inflation regime of the past two decades will end.
Positive in our chart below means stocks and bonds are inversely correlated in price, so your “60/40 portfolio” is safe. We believe this is a false narrative, as under normal conditions, over the last two hundred years, stock and bond prices have been positively correlated. In fact, a more senior member of the TwinFocus Research Team remembers that at B school during the mid-80s, the assumed correlation between stocks and bonds was 20%. This means that bond yields go up and your stock valuations fall; this should make sense to anyone taking a financial analysis class. As the discount rate on future cash flows increases, stock prices fall.
This was always true prior to 1998. However, the opposite has generally happened since. Shown below is the correlation between bonds and stocks, the green represents the good times when stocks and bonds went in different directions, the red shows periods when they went in the same direction. For most of the last 200 years, we have been in the red
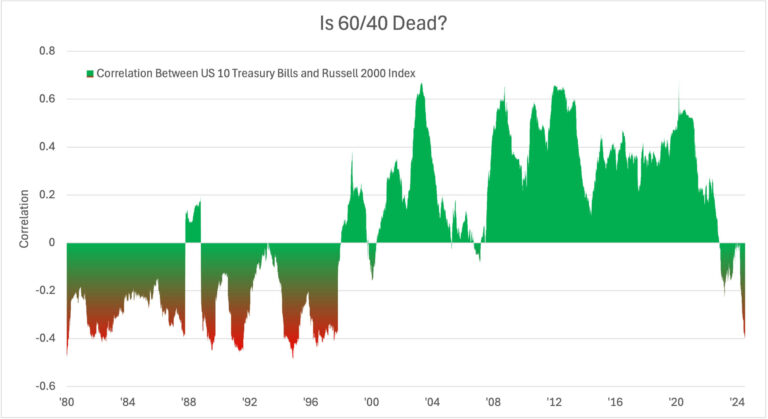
The increase in inflation odds in the past 2 years has brought the correlation back to normal level of the past two hundred years.
So, while the data on inflation is inconclusive, high-velocity signals like the price of gold, the recent sudden moves in longer duration rates, and the consistently sticky producer prices give reason to be worried about this relationship and corresponding portfolio positioning.
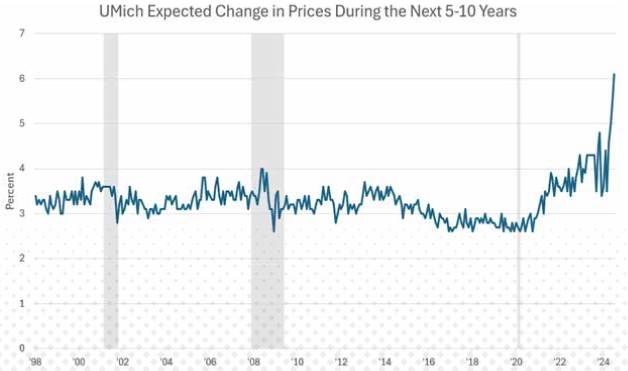
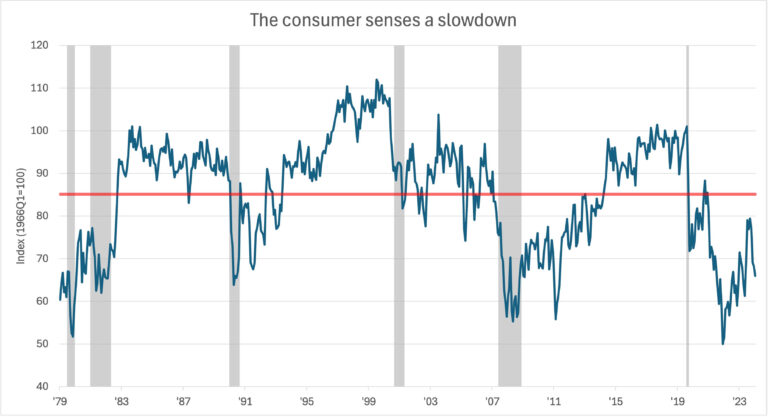
Consumers agree that something has changed, even if we do not have evidence of this in traditional data like CPI. We sympathize with this sense. Historically, 2% core CPI was the combination of 0% to modestly negative core goods and 2.5% 3.0% core services inflation.
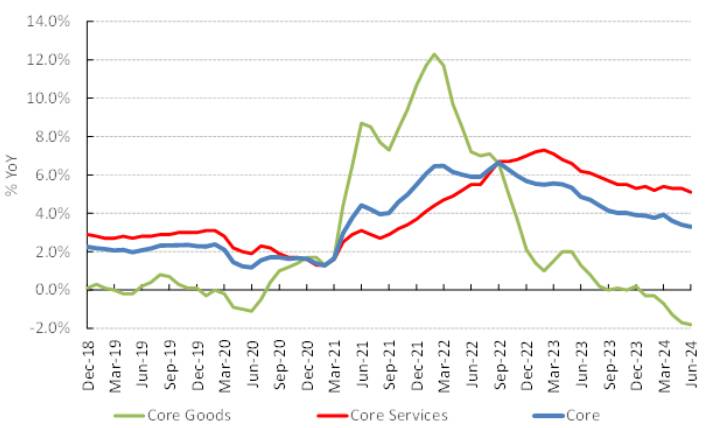
While core goods are deflating and core services are easing, it may prove difficult for core inflation to mean-revert to the 2% level.
- Obligated money from previous fiscal policy, i.e., American Rescue Act, Inflation Reduction Act, and Infrastructure Act will likely be spent before provisions expire in 2025.
- A weaker USD, the likely policy of both parties, and higher tariffs, the stated policy of a Trump presidency, to promote domestic production, are inflationary, making imports more expensive, a headwind to core goods deflation.
- Resilient labour markets and wage growth with reshoring, immigration policy and shifting demographics.
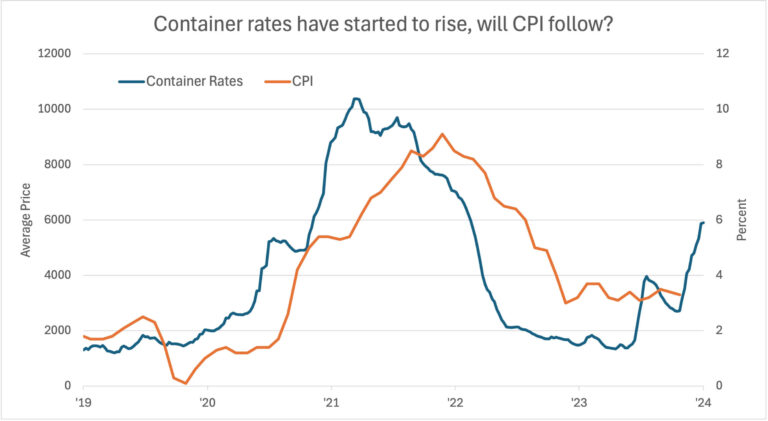
- As supply chains evolved in response to fragilities highlighted during the pandemic, and geopolitical risks rise, we could see higher costs. Shown below are container freight rates overlayed against the CPI. While not perfect, these building block costs have recently been a leading indicator for future CPI changes.
- The potential feedback loop of belief that inflation is over resulting in greater spending and other behavior that leads to more inflation
Positioning
-
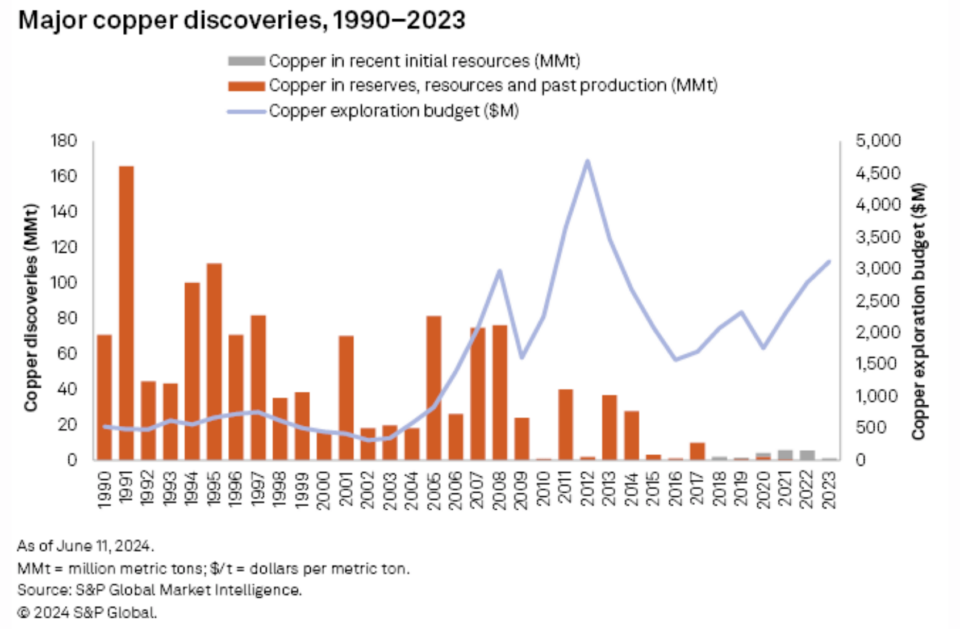
- AI Picks and Shovels. AI is more complicated than owning the technology’s beneficiaries and enablers, like Nvidia. We like a basket of pick-and-shovel plays on the need for more data centers here and abroad to support compute capacity for AI: Copper, Electric Utilities, and Natural Gas, in addition to the prominent enabling companies. The chart below shows the asymmetry in the copper opportunity. We believe this is a long-term opportunity that will be subject to regulatory and reflexivity risk, resulting in potential short-term volatility.
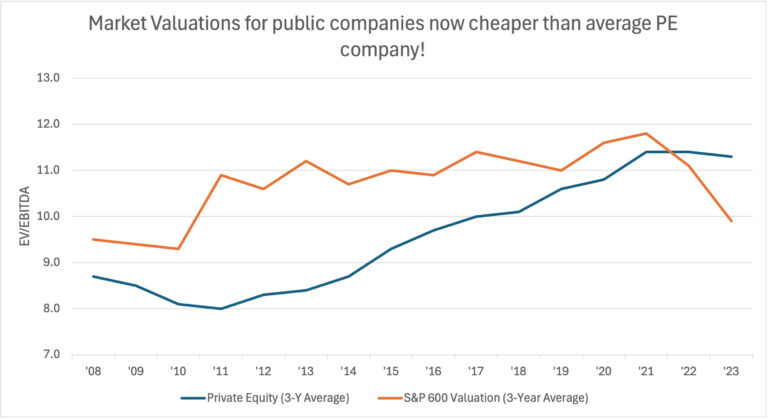
- Private Equity in the words of Roberto Duran against Sugar Ray “No Mas”s”. We are becoming increasingly convinced that broadly speaking the net after-tax excess returns for the option of locking up your money for seven to ten years (+) vs. owning liquid assets have disappeared. While it has been a fantastic asset class for three decades and we have supported it, we believe today that broadly speaking, the odds of winning have fallen dramatically due to the high starting valuations and abundant capital chasing returns
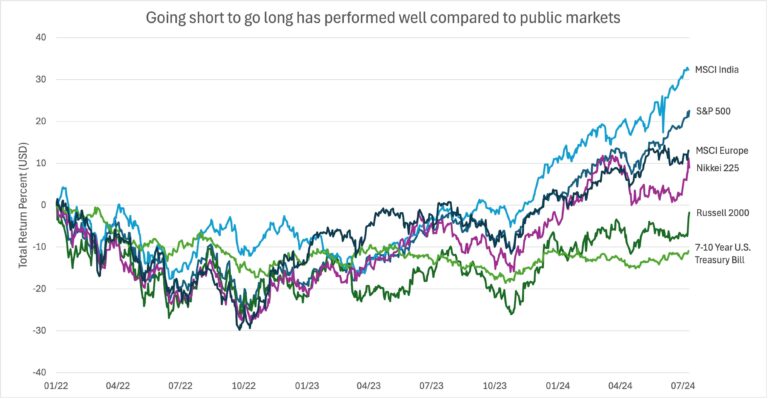
- Private credit “más por favor” Instead, we continue to seek out more focused opportunities, particularly within private and structured credit, supported by market imbalances that provide for attractive risk-adjusted expected returns with a solid margin of safety and low correlation to public markets. We are currently reviewing strategies that make structured loans to smaller companies within the real estate and defense sectors..
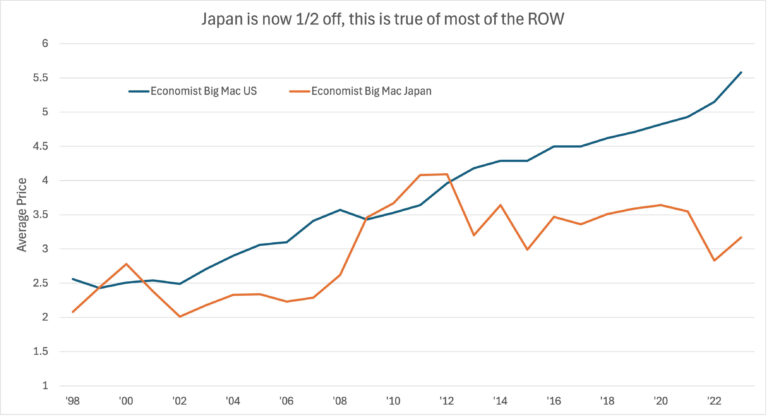
- Add Non-USD Assets. Last quarter, we asked, “Is the US exceptional?”. While we still believe US companies are, on average, operating at a truly exceptional level relative to the rest of the world, we believe most of that exceptionalism is discounted. As a result, the benefits of diversification away from dollar assets are the best they have been in two or more decades.Recently, we met with a successful and thoughtful Japanese PM, discussing everything Japan was doing right. Companies, on average, have had much stronger governance, have given capital back to investors, announced corporate restructuring, and become more friendly to the capital markets. Our Research Team left the discussion feeling that Japan was closer to the US than it had been in 30 years. Will the U.S. still be exceptional in 30 years? Is our ability to hammer out economic and intellectual property returns better than the rest of the world? Probably, but they are catching up.The PM also made an interesting observation, holding everyone’s favorite drug of choice, a cup of coffee; he asked if we knew that a cup of Starbucks is now two times more expensive in Boston than in Tokyo.Below is the “Patty Power Index” from the Economist. The chart shows that the investor cited above was right, in the last 17 years, burgers on a dollar basis are about the same in Japan, but they are up 80% in the United States. Over time, these values tend to revert, but it can take years. Almost all U.S.-based and foreign investors are now overweight dollar-based assets through price appreciation or tacit overweight. The call was right, but we suspect it will be less suitable over the next few years.
In addition, as the odds of Trump’s presidency increase, the odds increase that a global weak dollar policy will be enacted.We have several strong non-U.S. equity strategies that we believe will perform well. In addition, for the first time in decades, we are warming up to the rest of the world’s corporate and sovereign debt relative to U.S. debt. - Stay Short Duration. The unprecedented political events of the last few weeks have been tragic on many fronts, and they sadden us. As market watchers, we would say only one important thing changed: the increased odds of a Trump presidency. This resulted in a series of minor adjustments in market performance; however, the move has been profound for longer duration treasuries versus shorter duration.
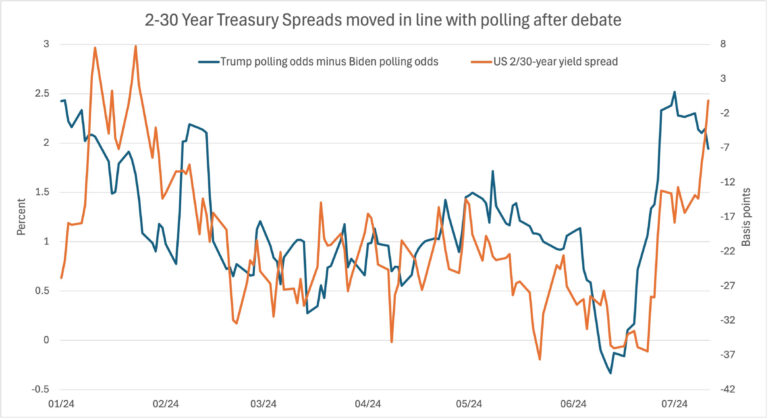
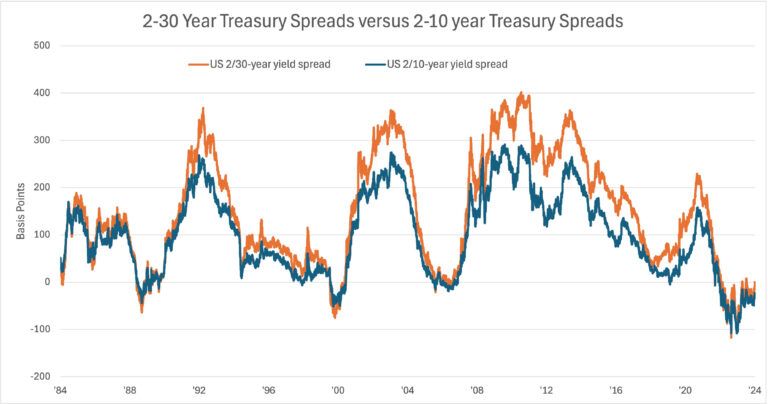
This is called the term premium, and the read is that long rates are increasing. The Biden/Yellen team issued short-duration treasuries, and market watchers suspect that Trump and his team will be more active in issuing longer-duration debt. This has implications for the market, and we like our positioning, which is generally focused on short duration bonds, but maybe the trade has just started.Below is the spread of 2-year treasuries vs. 30 years. In most periods over the past 150 years, the spread has been 150 bps; we just got to zero, and it can go a lot wider! Next is a shorter-period chart showing the positive relationship between long-term yields and Trump’s election chances. The last chart shows how aggressively the U.S. Treasury has issued shorter-dated debt.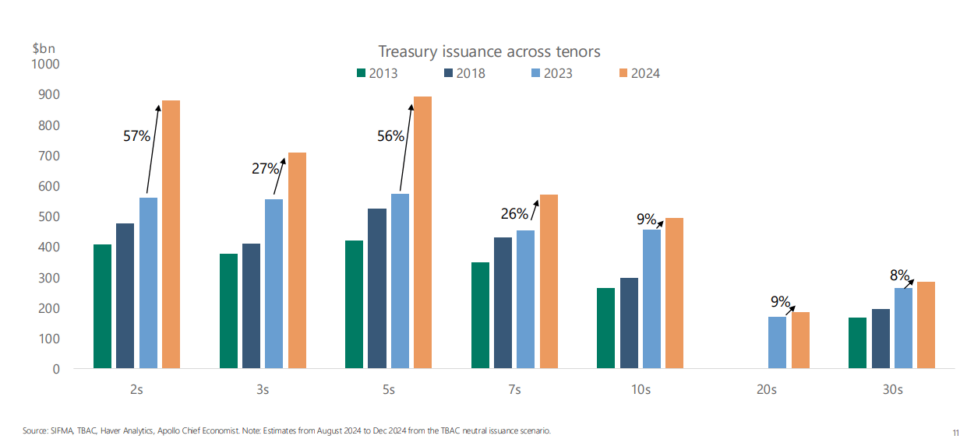
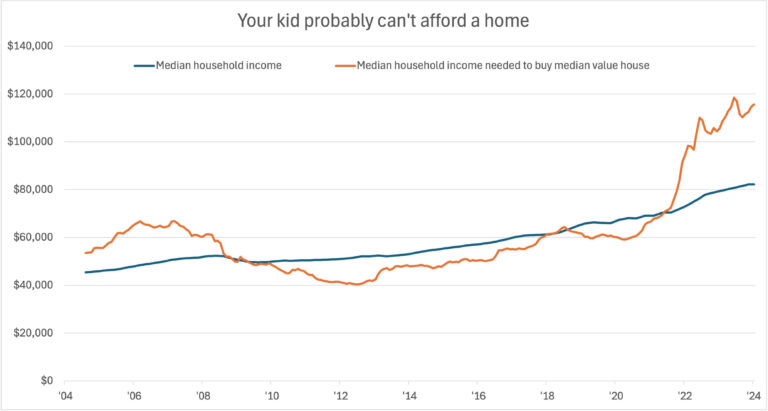
- Household formation. A popular topic among our summer interns at TwinFocus is whether parents should help their kids buy their first residence. Years ago, the dilemma was whether to fund college; now, they need housing. UGH! Well, the younger crew has a point: housing is not affordable in the U.S. As a result, without a significant social engineering project or dramatically lower rates, the dream of home ownership is out of reach for the median earner in the United States. We have some thoughtful ways to make this family-friendly and tax-efficient.

Conclusion: Find Shorter Lines
The logical alternative to “being greedy when everyone is fearful” is to “be a little fearful when everyone else is greedy.” Today there are just a handful of long lines in the market, and that makes us take pause. Not to belabor the analogy, but if everyone is in just a few lines, that means few are in the other lines which we have sought out and brought to clients over the last few years.
If everyone is betting on US exceptionalism, private equity returns, and quickly falling rates and inflation, then naturally there are short (or no) lines for international markets, niche private credit, commodities supporting power providers, or short-duration assets, which is where we see value today.
MEMORANDUM DISCLOSURES & DISCLAIMERS
This Memorandum is confidential and may contain legally privileged and proprietary information of Twin Focus Capital Partners LLC (“TwinFocus”). It is intended solely for the use of the Recipients to which it is addressed. If you are not the intended recipient, you are hereby notified that any dissemination, copy, disclosure, use or action taken based on this Memorandum is strictly prohibited and may be unlawful. If you received this Memorandum in error, please contact the sender immediately and destroy the material in its entirety, whether electronic or hard copy.
This Memorandum may not be otherwise redistributed, retransmitted or disclosed, in whole or in part, or in any form or manner, without the express written consent of TwinFocus.
Investments involve numerous risks, including, among others, market risk, counterparty default risk and liquidity risk. In some cases, securities, strategies and other financial instruments may be difficult to value or sell and reliable information about the value or risks related to the security, strategy or financial instrument may be difficult to obtain. Income from such securities, strategies and other financial instruments, if any, may fluctuate and the price or value of such securities, strategies and instruments may rise or fall and, in some cases, investors may lose their entire principal investment. Foreign currency rates of exchange may adversely affect the value, price or income of any security or financial instrument mentioned in this Memorandum. Investors in such securities and instruments effectively assume currency risk.
Hedge fund and other alternative investments are generally unregulated and considered inherently very risky and you can lose material portions of your principal in very short periods of time. Prior to making any investments in any hedge fund managers and alternative investment strategies, you should thorough review all subscription documents and confidential offering memoranda provided by the managers/strategies, paying particular attention to the risk disclosures. You should not invest in such managers/strategies if you are not thoroughly comfortable with these risk disclosures or do not understand and/or appreciate the increased levels of risks associated with such strategies. Additionally, this Memorandum may provide information regarding private funds/strategies/investments which are exempt from registration under the Investment Company Act of 1940 pursuant to Section 3(c)(1) and/or 3(c)(7) which were offered as private placements in reliance on Regulation D of the Securities Act of 1933. Each individual fund/strategy and NOT TwinFocus shall have the sole responsibility for (i) formally qualifying prospective investors to ensure they meet the suitability criteria to invest in each relevant fund/strategy and, once qualified, (ii) sending the formal offering documents and other materials to each prospective investor.
Any information relating to the tax status of financial instruments and/or strategies discussed herein is not intended to provide tax advice or to be used by anyone to provide tax advice. Recipients are urged to seek tax advice based on their particular circumstances from an independent tax professional.
Any waiver by TwinFocus of any section of this Memorandum Disclaimer Statement should not be construed as a general waiver of any other section and/or the entire Memorandum Disclaimer Statement.
The information, including but not limited to forecasts and estimates, in this Memorandum was obtained from various sources and TwinFocus does not guarantee its accuracy. Although the information contained in this Memorandum is from sources believed to be reliable, no representation or warranty, expressed or otherwise, is made to, and no reliance should be placed on its fairness, accuracy, completeness or timeliness.
This Memorandum may contain multi-year financial pro forma planning projections, predictions, return assumptions, as well as other financial, legislative, statutory and client balance sheet assumptions that are for illustrative purposes only and no representations or warranties, expressed or otherwise, are made to, and no reliance should be placed on their fairness, accuracy, completeness, or timeliness.
Past performance is not indicative of future results and there can be no assurance that the future performance of any specific investment, investment strategy, or product will be profitable, equal any corresponding indicated historical performance level(s), be suitable for client portfolios or individual situations, or prove successful. Due to various factors, including changing market conditions and/or applicable laws, the content may no longer be reflective of current opinions or positions. As such, all opinions, projections and estimates are as of the date of the Memorandum and are subject to change without notice. TwinFocus is under no obligation to update this Memorandum and Recipients should therefore assume that TwinFocus will not update any fact, circumstance or opinion contained in this Memorandum unless specifically requested. TwinFocus and any director, officer or employee of TwinFocus do not accept any liability whatsoever for any direct, indirect or consequential damages or losses arising from any use of this Memorandum or its contents.
This Memorandum may contain current opinions of third-party authors and not necessarily those of TwinFocus. Such opinions are subject to change without notice. This Memorandum may contain references to market indices. Such information is presented to show general trends in certain markets for the periods indicated and is not intended to imply that the strategy(s) discussed and/or reviewed are similar to the indices either in composition or element of risk. TwinFocus does not make any representations as to whether the indices may or may not be unmanaged, not investable, have any expenses and may or may not reflect reinvestment of dividends and distributions. Index data is provided for comparative purposes only. A variety of factors may cause an index to be an inaccurate benchmark for a particular portfolio/ manager/ strategy and the index does not necessarily reflect the actual investment strategy of the portfolio/manager/strategy discussed and/or presented in the Memorandum. Current period returns may be estimates. Actual index returns and/or estimates are calculated and presented to Twin Focus through third party software providers and as such, may differ from the final figures produced by the index provide.general waiver of any other section and/or the entire Memorandum Disclaimer Statement.