
Q1-2024 Commentary: US Exceptionalism

Fortune ran a cover story in February discussing the phenomenal performance of the US post-pandemic and asking the question,
“IS THE US EXCEPTIONAL VS THE REST OF THE WORLD?”
The Wall Street Journal ran a story on 4/15 with the title, “Envy of the World,” with a similar story line.
Their key points were:
- Stock market performance is exceptional.
- Economic growth is stronger than most and defies conventional wisdom about business cycle fatigue.
- There are obvious successes in the innovation economy from AI to biotech to advanced education.
- Strong growth despite short term rates increasing 500 bps in 2 years.
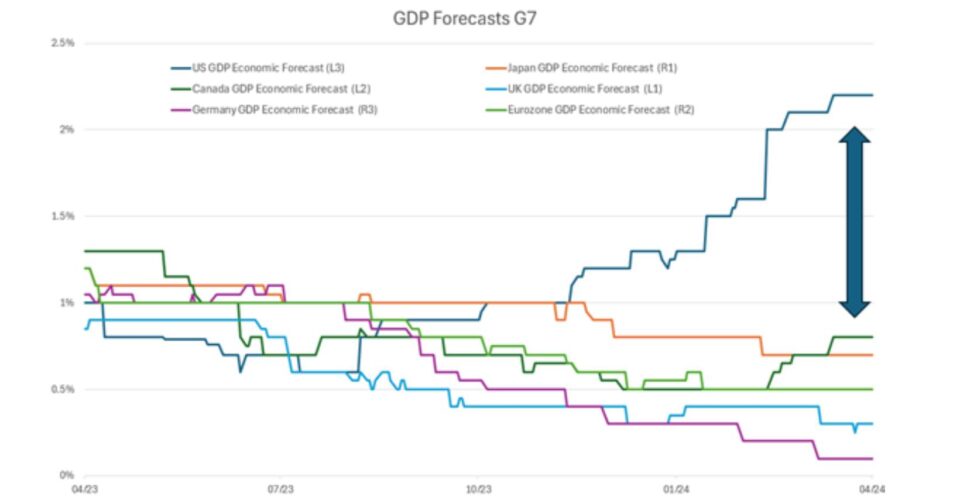
The chart below demonstrates the phenomenal resilience of US GDP over the past year. While most economists have cut forecasts for most developed economies, the US is the outlier, the chart below shows the large deviation in year over year GDP growth.
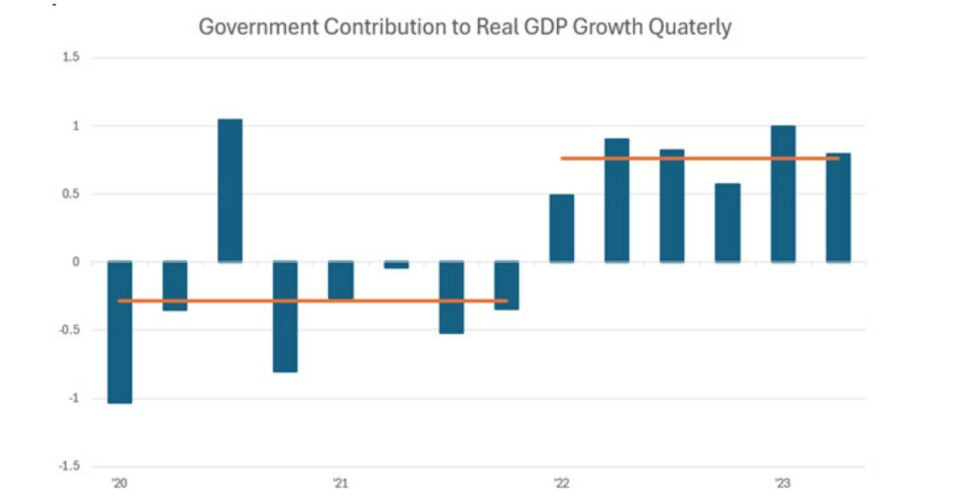
On the negative side, excess consumption related to COVID savings is pronounced in the US. Our fiscal impulse was twice the size of any other country during and after the pandemic, and some of the excess growth can be explained by enormous pro-cyclical spending.

Exceptional Productivity?
No matter how you cut the numbers, economic performance has been exceptional, and it has shown up in the first quarter with some of the best markets in recent times. For frame of reference, since the September lows, we have seen the best 6-month period ever for the stock market, except for rebounds from deep recessions.
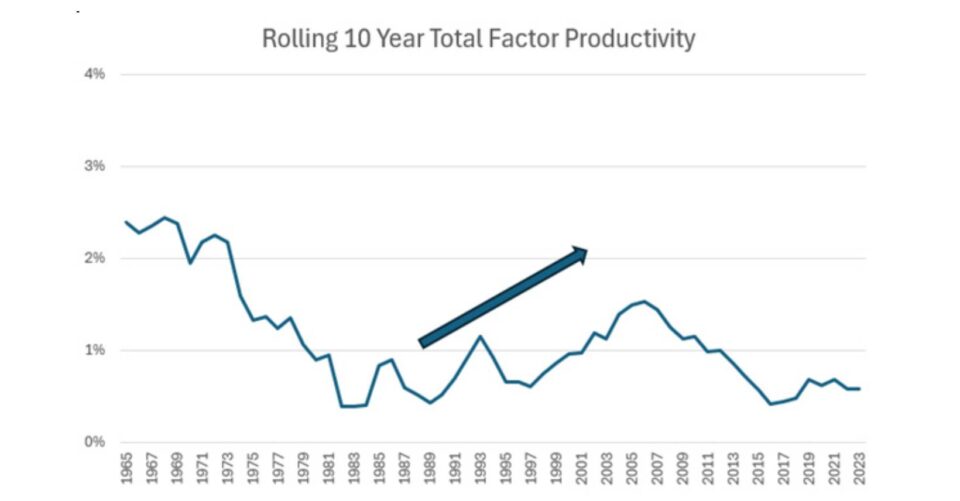
I was curious, is there similar evidence of exceptionalism in the productivity statistics?
The answer is no.
Shown below is Total Factor Productivity. While we can debate the accuracy of the year-to-year changes, the larger sample size shows a simple story: productivity picked up during the PC era, and the advent of E-mail. For those younger than me, when I started my prior career as an engineer out of college building computer-aided drawings, it might take 4 weeks of overnight shipments and large blueprint printers to verify documents. By 2000, it could be done in mere hours…clearly a productive increase. This is what showed up in the productivity numbers, which picked up from the late 80’s through 2000.
Just to make sure I wasn’t missing anything, I listened to Cathy Wood’s monthly call where she was accompanied by her “futurist.” He explained that basically, drivers of productivity improvement were all building on each other, and argued the best was yet come. He went on to explain that AI, the cloud, and robots were all additive to growth, and argued that it was possible that GDP growth, which averages 3.0% today, could accelerate to 8.5% as these growth drivers are realized and compounded.
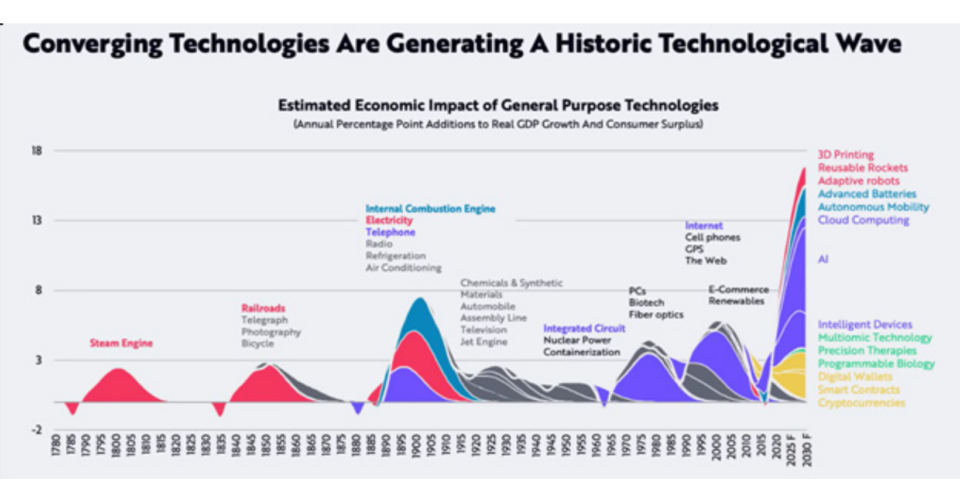
Most humans are born optimists. We like to follow the crowd, and I’ll play along. If this forecast is right, we have truly entered the golden years like no other.
My issue with forecasts like this are that I saw the same thing during 2000. While many of the items forecast in 2000 were right, they just took decades longer to play out than originally forecast. It is possible the market and forecasters are right about AI and its dominance in the markets and economy over the next decade. My hunch is that they are directionally correct., but the timing will be longer than planned.
To be sure, one more recent example of consensus being certain but being early was the rage of “autonomous driving taxis” 8 years ago.
I was invited to a special conference hosted by one of the largest brokerage firms to discuss the imminent move to autonomous vehicles and trucks. It was said that by 2020 most taxi drivers and truck drivers would be displaced. On stage was every auto maker, supplier, and graphics chip company, explaining how they were well positioned and that the concept of level 5, truly autonomous driving was imminent.
CNN highlighted this optimism in an article, pointing out that in 2017, “General Motors promised mass production self-driving cars by 2019” and that “Lyft said in 2016 that half their rides would be self-driving by 2021.”
I highlight the quote just to remind everyone that as humans, we are optimists, and we like to follow the crowd. I was no different as I headed to this conference. I was influenced by the obvious allure of being able to read and drive a car.
I mean, who wouldn’t be?
Still, I do believe AI is different than autonomous vehicles, and I want to highlight how impressive the build has been so far. The investing world has never seen something at this scale. It reminds me of my early days of tech investing when telecom start-ups were consuming enormous capital. This, though, is faster and more dense. Shown below is the obvious ramp in demand for NVDA chipsets.
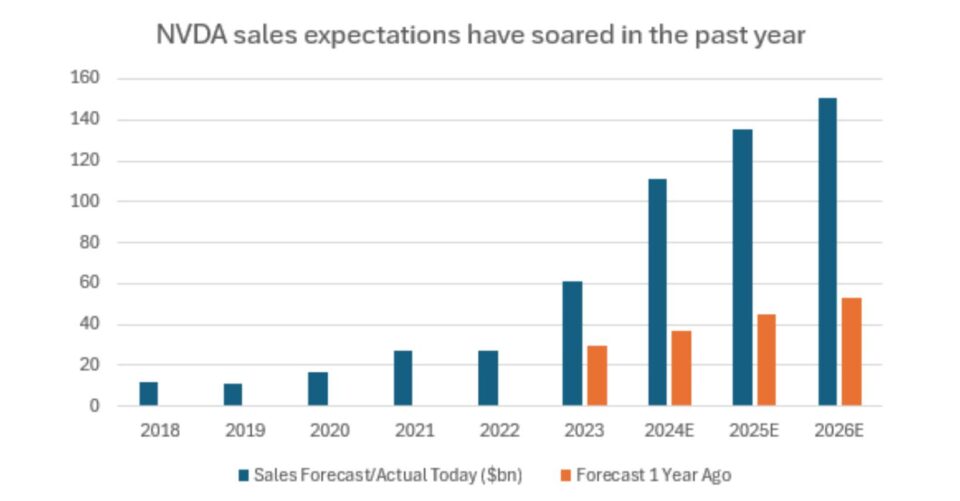
Truly staggering.
In one year, forecast 2024 revenue has increased by more than $60 B, and this is for a company that only had $17 B in revenue a few years ago. The demand for chips that allow the training of AI and the building of data centers is once in a lifetime.
What is equally incredible is that many of their largest customers, made up of the other Mag 7 (Amazon, Microsoft, Apple, Tesla, Alphabet and Meta), have impressive earnings ramps that allow enormous capital spending for building out data centers.
Shown below is the increase in estimates for the Mag 7 plotted against the other 493 companies in the SP500. It is not surprising that these companies have performed well.
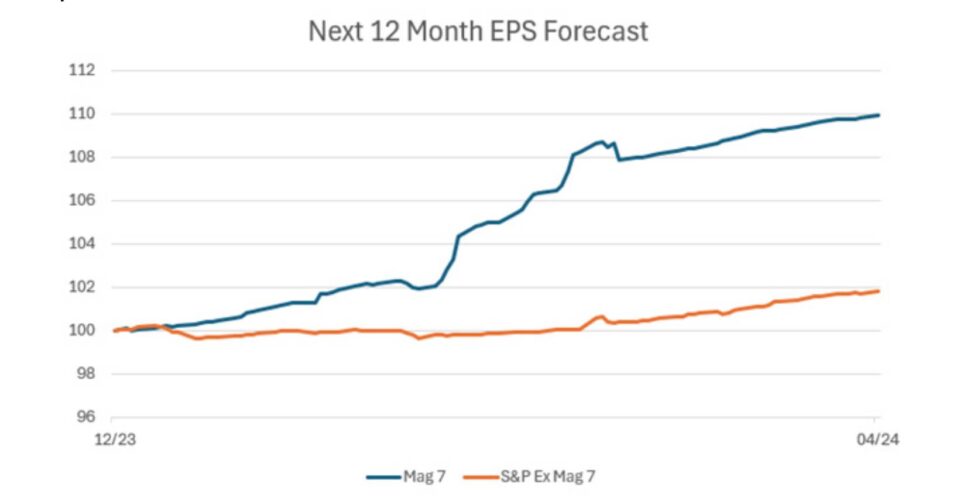
The collective EBITDA of every company in the Mag 7 except NVIDIA is forecast to be 630B in 2024. Just these six companies alone have the capacity to drive enormous demand. It’s also important to note that these cash flows historically went to medium-sized acquisitions, which are no longer fashionable due to the current anti-trust sentiment against scale mergers. As a result, the cash flows are redirected to fuel expansion and capital spending.

Immigration and exceptionalism?
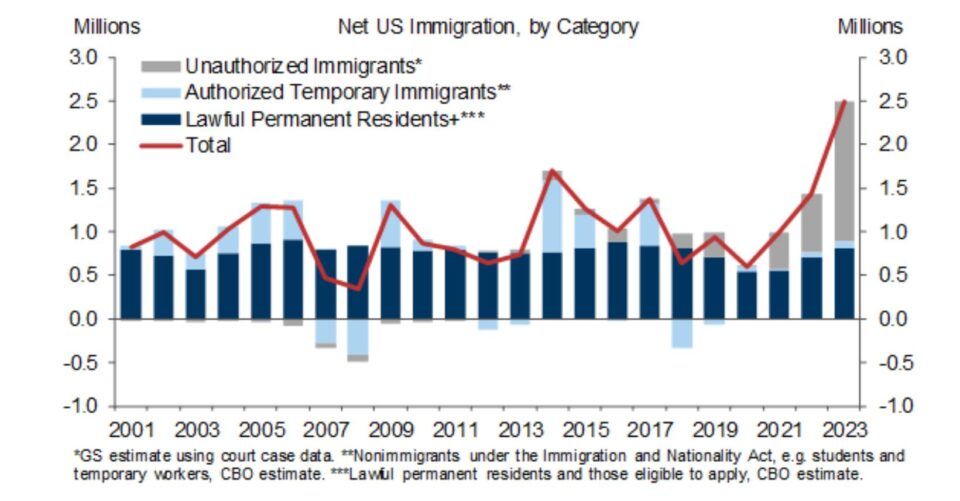
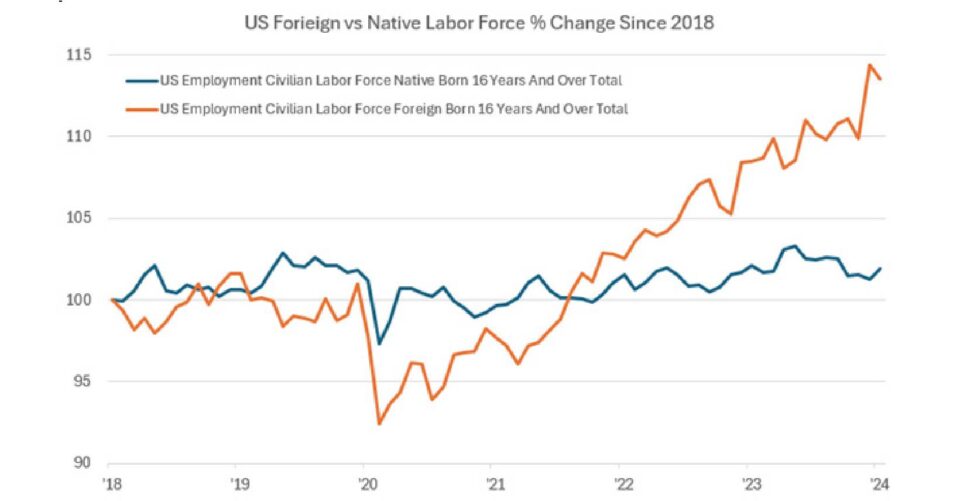
One of the most contentious items in recent political debate is immigration. I don’t have strong opinions either way, and this is not a commercial for or against immigration. Rather, this is just to state the obvious: if you are going to have an exceptional economy, you need to grow, and most growth over history is a function of working-age population growth. What has been incredible about our economy is its ability to absorb a truly staggering number of workers. These two charts put immigration and worker growth into perspective. The first tells the headline news story: we have seen more illegal immigration than normal.
The second tells a more nuanced story: foreign-born workers are younger and are allowing the economy to grow with less inflationary pressure. This is nirvana for economists if not so for border-town mayors in Texas.
So, the US has led all the large technology and medical breakthroughs of the last few decades, we have successfully digested millions of new workers into our economy in 4 years, and (based on stable rates despite the growth in deficits) has convinced the world that we are a (if not the) reserve currency. Finally, we have convincingly grown faster than the rest of the world since COVID.
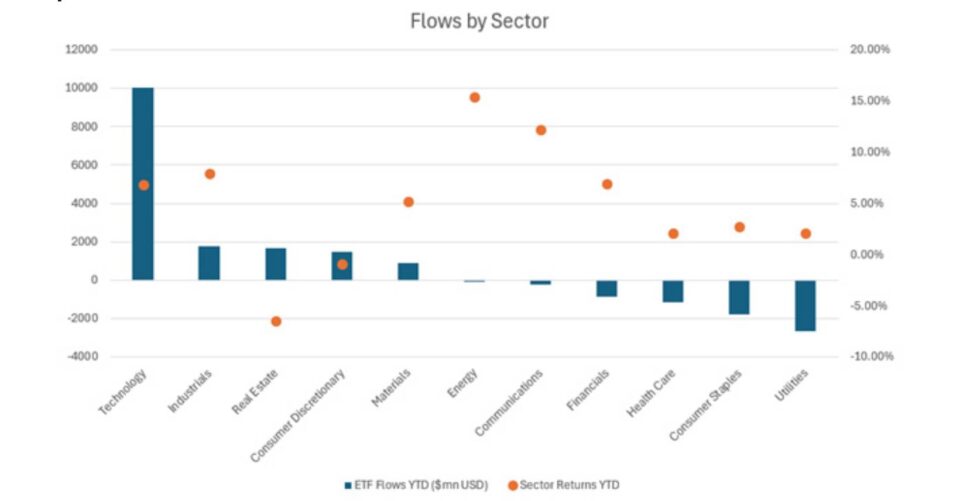
As a result, it is no surprise that our market has been one of the most resilient over the last few years. Clearly, technology and its related investments have been winners in both performance and are universally considered consensus, as shown by this chart. What is curious to me though is that flows into technology are pegged near an all-time high, but the performance of other sectors is now noteworthy, without flows. Potentially a contrarian buy signal. The bars represent flows, and the tech sector dominates all other flows, the dots represent YTD returns, the leader is energy.
So where does this leave us if we believe the US is exceptional, but so does everyone else?
I don’t intend to have all the answers. Instead, let me offer some items to put the recent historic rally into perspective, highlight areas that may be worth worrying about, and give some thoughts on where to invest.
The Market and Observations
A client once told us, ‘I love charts; they are like fine art to me because sometimes they can tell a story without a thousand words.’ At the risk of overusing them, we present a few charts to ponder.
Inflation Expectations
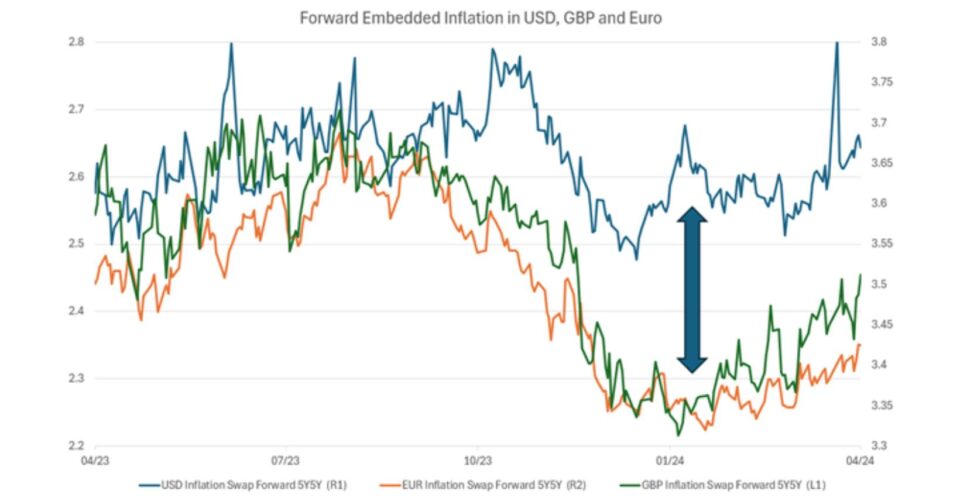
Despite enormous immigration, the capital markets are discounting much more stubborn
inflation in the US than abroad when measured by 5-year forward embedded inflation in the
TIPS market. The divergence between the UK, EURO, and the US is staggering. It is a sign that we have more growth, but also a tell that inflation is likely a more stubborn issue here.
Our hunch is that gold buyers are right and that we have finally done too much to stimulate the economy with fiscal spending. (Clearly, we are still not consensus in this view). Shown below is the embedded inflation expectations in the 5 year TIPS market, in the past year there has been a noticeable change between the US and the rest of Europe, where ours are about flat and Europe has come in. This means as Christine Lagarde, the President of the European Central Bank, just said, we (meaning Europe) have room to be more aggressive with our rates than the US.
Investors Are Bullish and it Doesn’t Matter
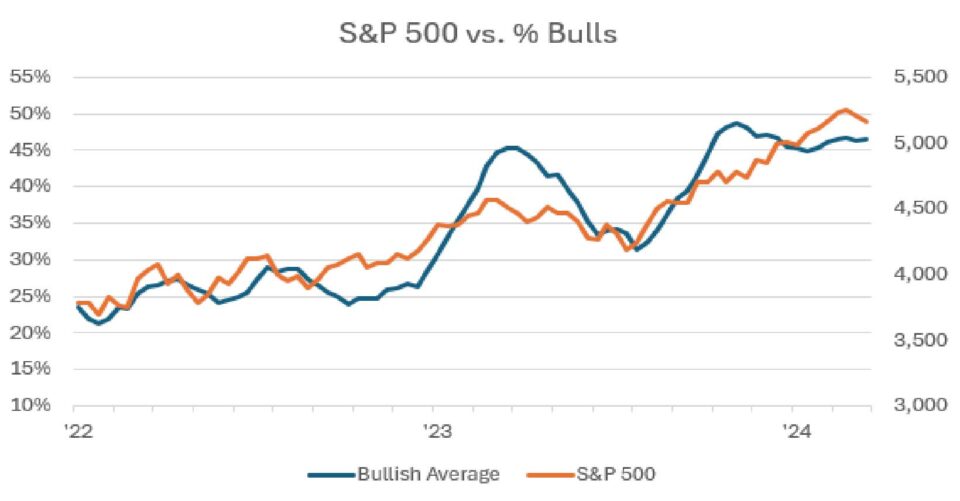
As Yogi Berra said, “Nobody goes there anymore. It’s too crowded.” The one thing that jumps out from these charts is that investors love stocks. However, when studying longer-term data, the sentiment indicators studied over decades have no bearing on future returns. Said another way, “Yes, there is a long line to buy stocks,” but that doesn’t mean anything. Shown below, you can see the almost 1/1 correlation between Bulls and the recent market performance.

The US Government Has Bonds to Sell You This Year
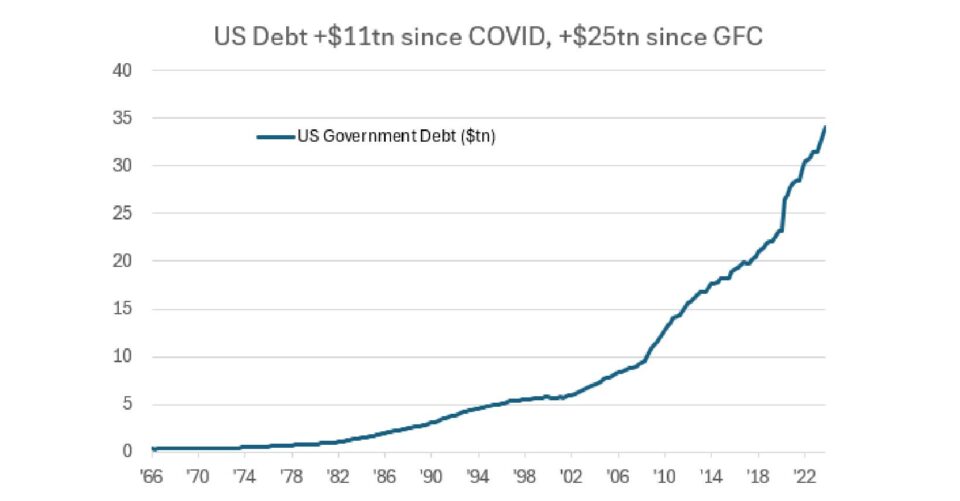
You have heard most talk about the growing fiscal deficit.
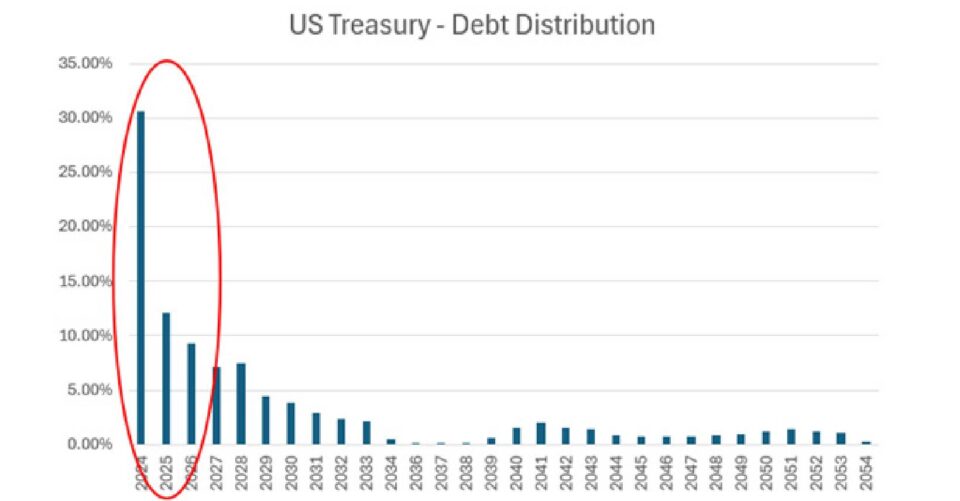
There is simply an enormous supply of treasuries coming to the market. The first graph highlights that 30% of all US Treasuries need to be recycled in the next 3 years. The conclusion for me is that the supply of treasuries will explode, and based on the trend in gold, demand is slowing at other central banks. This leaves the US saver as the remaining obvious buyer.
Unfortunately, I for one, am not that interested in loaning the government money for the next 30 years (maybe the next 2 though) at a rate that solves their budget deficit.
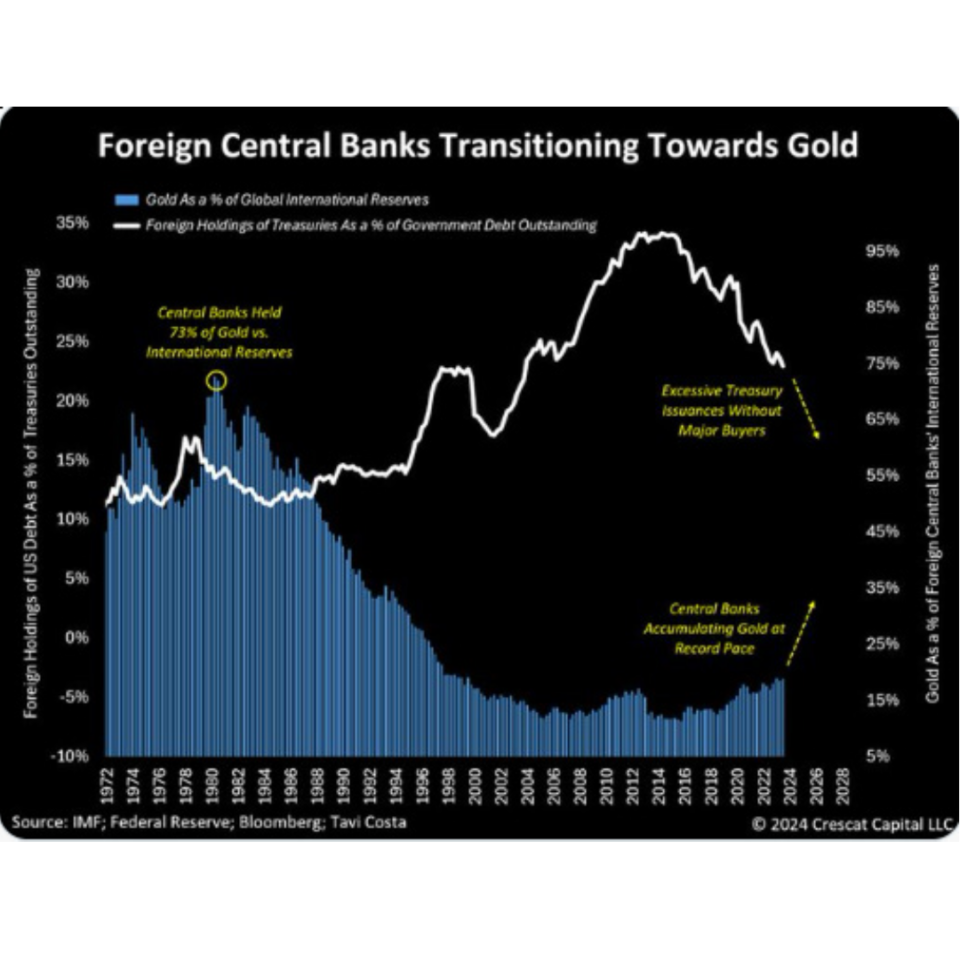
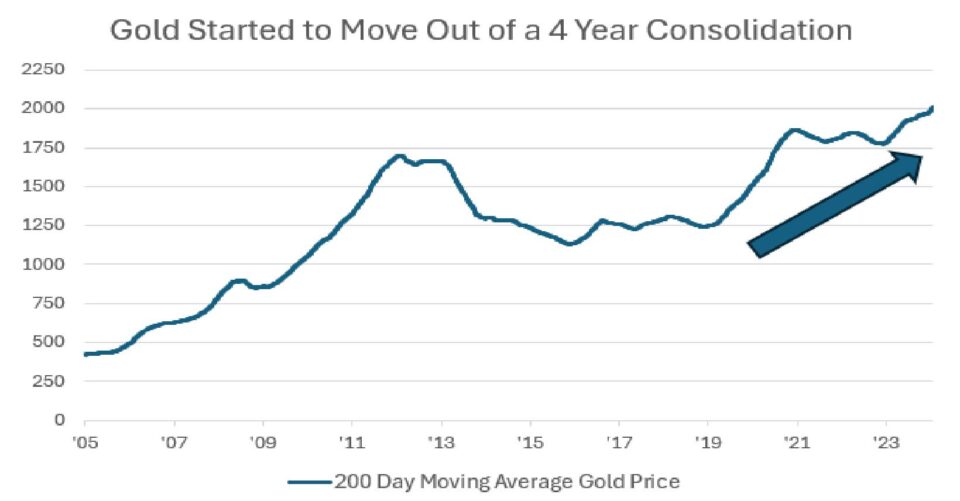

The longer I work in the financial world, the more complex it feels to me, and I have seen a million charts that make me think the worst is coming or the worst is over. They always appear obvious ex-post, but prior to that, signals lay dormant until history shows they were the signal.
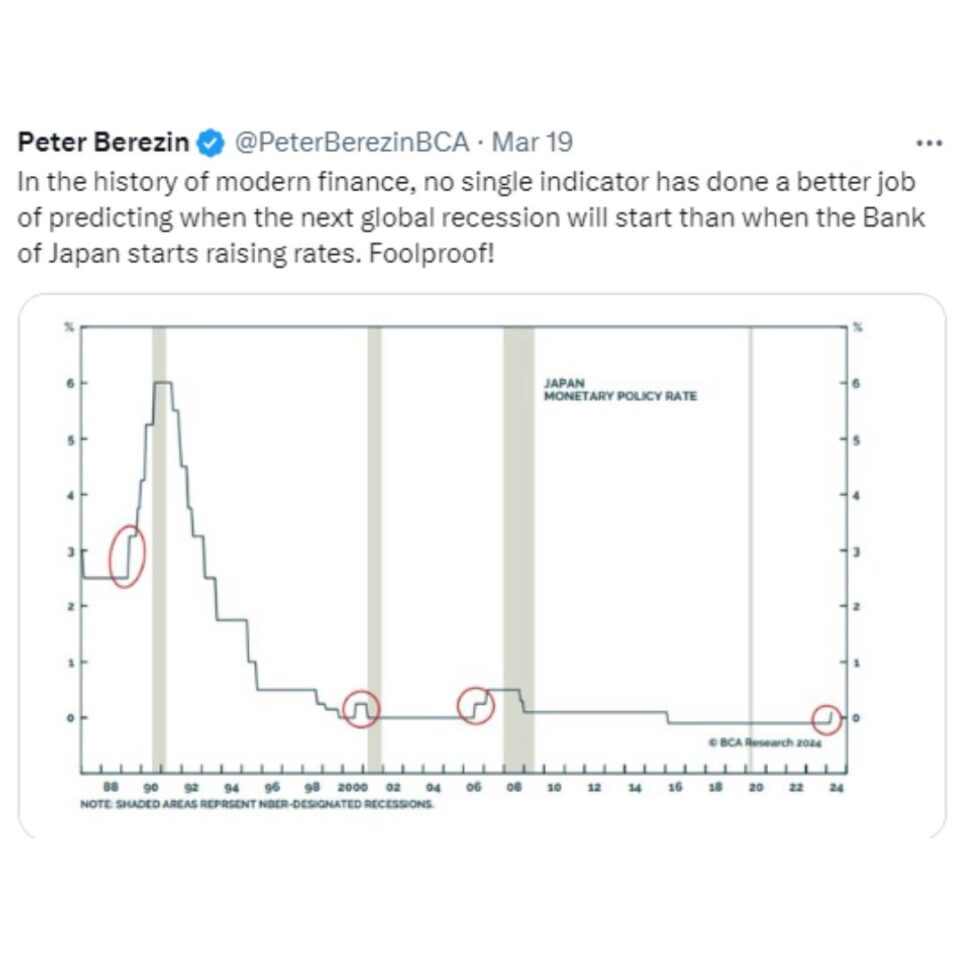
Peter Berezin, the notable strategist at BCA, posits that the policy rate in Japan is a great coincident indicator of a global recession. Knowing him, this is tongue-in-cheek, but the point here is that while the rates did go up last year in the US and Europe, and they likely slowed global commerce a touch, the real story for a global bank, global insurance company/or Berkshire Hathaway is that if Japan has our back, we can still find somewhere in the world to borrow for next to nothing and drive economic growth.
Has that ended? We don’t know, but we are watching with eagerness the willingness of
capital markets to run stimulative monetary policy in Japan with no consequences.
Rate Cuts: Six…No, Three…or Two…Maybe None?
The most popular topic I see debated on CNN, CNBC, or Bloomberg is how many rate cuts the US Fed will follow through with this year.
We have no strong opinion on this, except to say that the current consensus of two cuts feels like the high end of rate cuts without a major pullback in financial conditions. The Financial Conditions Index is an attempt by economists to measure how stimulative capital markets and central banks are for future growth. Based on history, with financial conditions loosening at this rate, we will have a pick-up in growth.
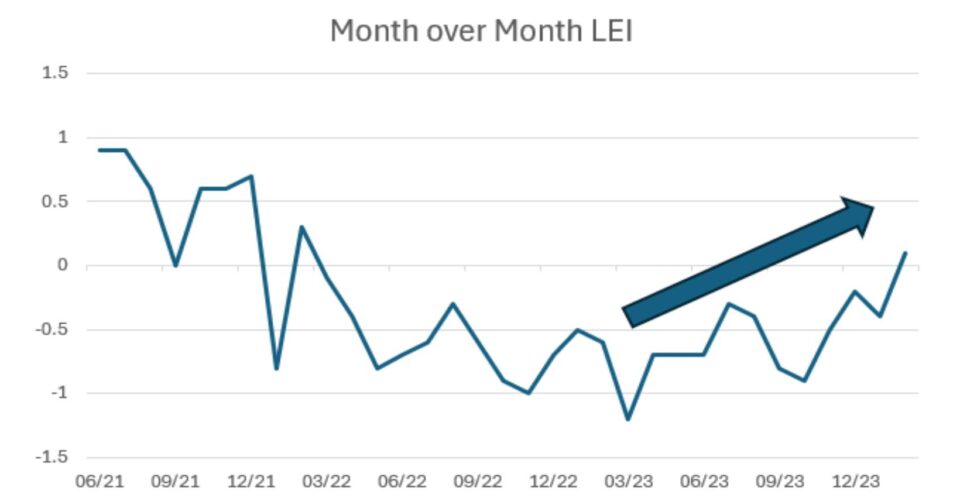
Based on history, the Fed typically doesn’t cut rates when growth accelerates. Hence the conundrum for our central bank. Expanding on this, if you told me the economy was accelerating, the unemployment rates was at decade lows, consumer savings was near a peak and profits were at record levels, I wouldn’t be surprised to see the market near an all-time high, but I would be surprised to hear of imminent Fed rate cuts. Shown below is one of the best real time measures of economic activity, it is turning up, a signal that economic activity is likely stronger in the coming months.
We Are All Momentum Investors Now
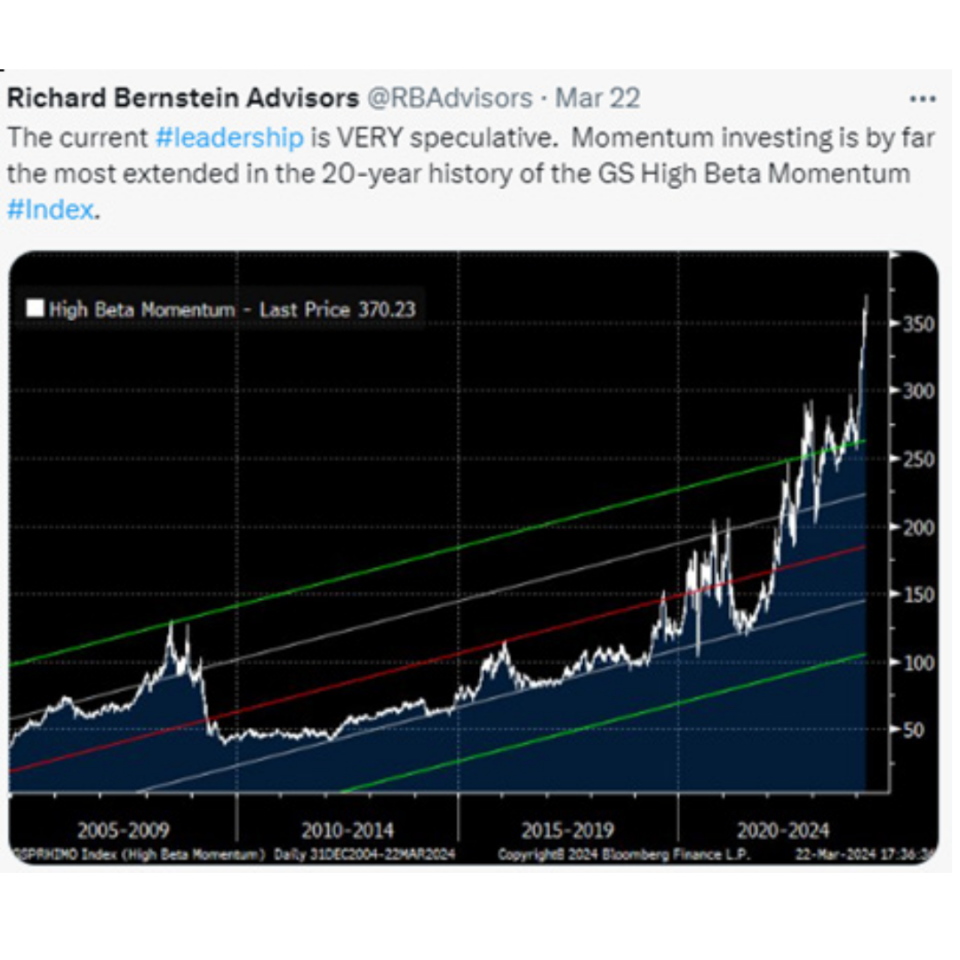
Is there a problem if we all believe the same thing or if we all respond the same way to inputs? Shown below is the performance of momentum. Simply put, if you bought was already going up, you continue to beat the market. You can see from the chart it’s been a good approach.
The likely causes of this are many, including the size of macro/short duration investors, the increase of price insensitive investors (e.g., trend following algorithms, automatic DC plan contributions) and retail trading, the high correlation of views in the market and the shift toward passive investing exacerbated by market-weighted index construction.
One consequence is a distortion of price signals that result in capital misallocations, e.g., over investment in chips at the expense of basic materials. The other is that feedback loops work in both directions, i.e., if “everyone” is wrong, it will be a tough day for capital markets. Shown below is a measure of the performance of the stocks with the strongest price momentum, typical the factor has some excess performance,
However as of late, it is off the charts. There are a few reasons for this, one the stocks like NVDA have continued to perform, so the momentum was right, second due to the outsized influence of ETF creation, those with momentum have more assets chasing their ideas and lastly this isn’t lost on macro driven quant shops, so they try and front run, effectively momentum creating momentum.
Soft Landing or No Landing?
Jamie Dimon in his annual letter mentions the market has discounted a 70% chance of no landing or soft landing and says that feels too high to him.
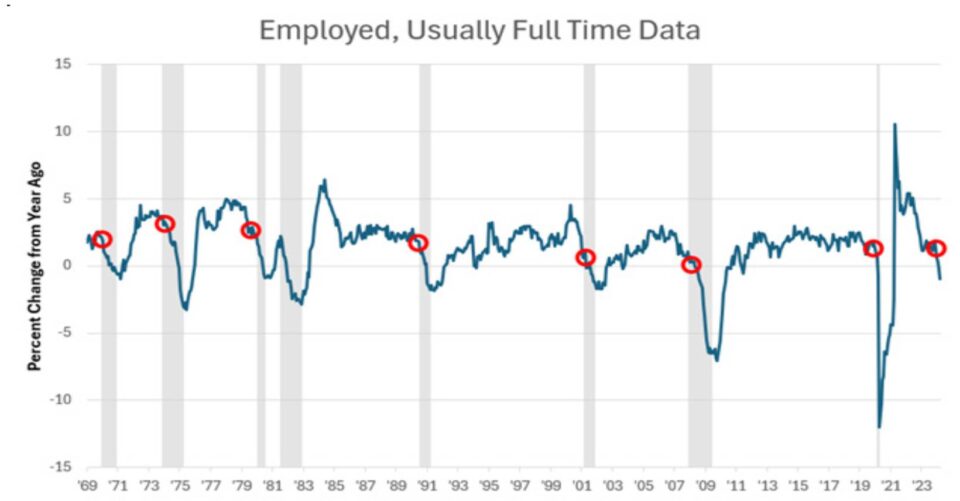
It is our opinion that no one knows for sure and that one should always be prepared for multiple market outcomes. However, the chart below may be worrisome. It highlights growth in full-time workers and has historically been a good early indicator of stress in an economy. Many times, the precursor to a recession is that companies are more cautious and as a result continue to hire but err on the side of more temporary workers and fewer full-time workers. You will notice that all recessions are preceded by a sharp slowdown in permanent workers, we are at that juncture today.
Private Credit Markets Dwarf Banks and That
Matters More Than Most Think
Thank you, Jamie, for your pearls of wisdom, buried in your year-end letter is the explanation for something that has riddled the market for over a year.
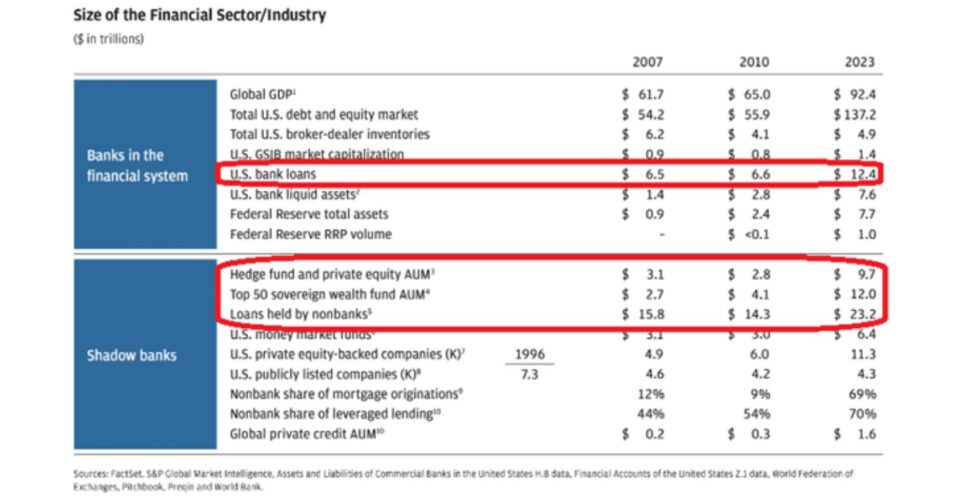
Simply, why hasn’t the flatness of the yield curve and/or rate increases had their normal transmission effect on growth. I think the answer can be found in the data table below. We can debate some of the math, but the high-level story is that US bank lending was $12.4 trillion and other definitions of available capital from hedge funds to sovereigns to private lending/equity now dwarf that amount.
Logical reasoning can suppose that investors that are paid 2 and 20 are more incentivized by client flows than banks who are constantly comparing the return to risk vs the existing bond market. It appears that while bank lending has slowed materially in the past year or so, the enormous increase in shadow lending has offset the decline. The data below shows the relative size of some of the capital markets. In the data, loans held by non banks dwarfs bank loans.
So, what should we do, or better said, where should we invest?
1. The US dominance and the uniqueness of the economy are hard to debate now. As a result, a position in our leading U.S. technology companies makes sense. However, overweight positions should be trimmed as the performance and the flows are at extremes.
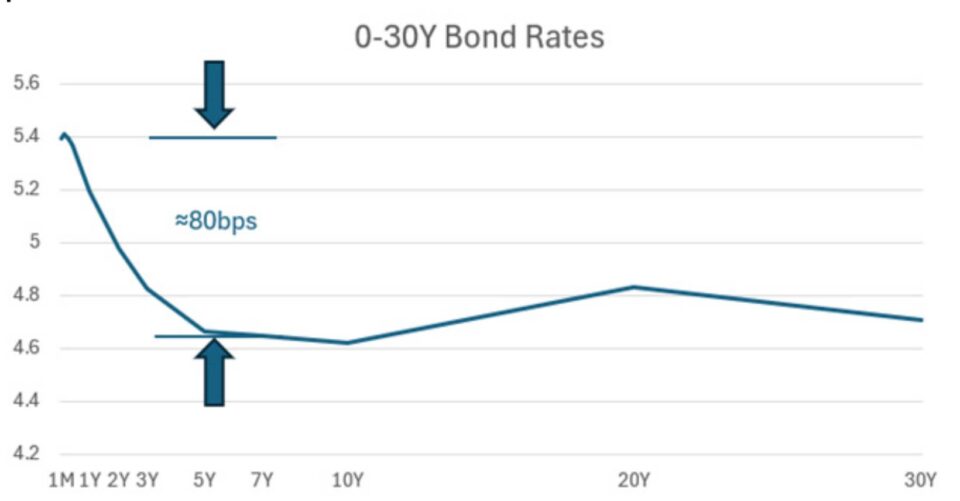
2. Powell, Biden, Yellen all seem uniform in keeping medium-and long-term rates suppressed. This has created an environment where the safest part of the yield curve (short duration) provides higher yields than the long end. This means going short to get long bonds. We have a few ways to think about getting yield in shorter-duration instruments, from active liquid to private illiquid to the simple purchase of money markets. All look more attractive to us than investment-grade (IG), high-yield (HY) bonds, and long-duration bonds, including municipal bonds (munis), than historically.
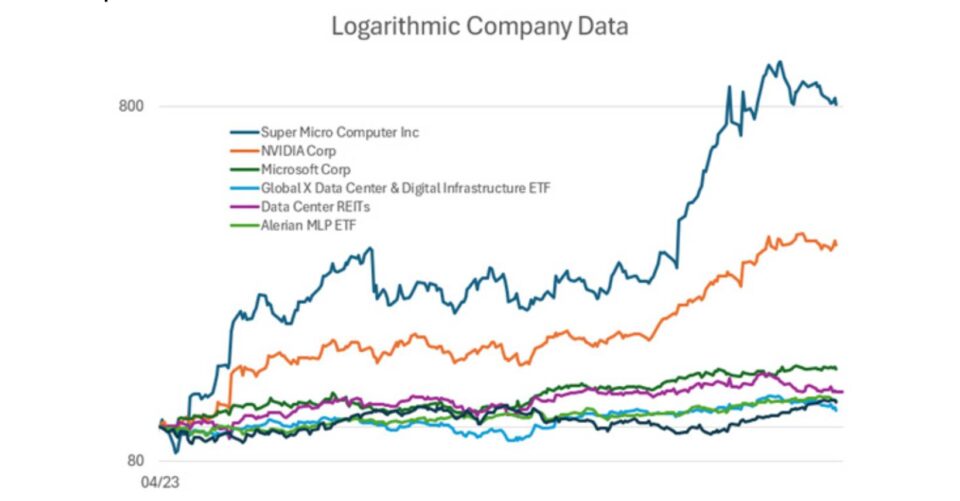
3. AI is real, it’s big and it’s going to be a topic of discussion for a decade. We can all debate the path and the speed, but the power to influence human productivity will prove too difficult for the capital markets to resist. These stocks all have one thing in common: they are beneficiaries of AI. SMCI sells the boxes, NVDA makes the chipset, Data Center REITs run the systems, and then we need power. SMCI is up 80Xs, NVDA is up 40Xs, the others dwarf the returns, but are still winners as we increase data centers and demand for power.
We believe that secondary winners from the AI build out will be copper and natural gas.
The demand for power, transmission for the future supply of chips and data centers is staggering. This means here and abroad we will need more electricity, the easiest and fastest way to ramp power are natural gas peakers, which benefits the demand for natural gas. In addition, LNG demand improves every year for the rest of the decade, and we have a depressed entry point for equities due to the low heating demand in the northeastern U. S..
Copper is used everywhere in data centers from chips to transmission, in addition the unfortunate build up in ammunitions globally leaves copper in short supply. The supply of copper has been curtailed by local regulations and a soft market, as a result demand can outstrip available supply.
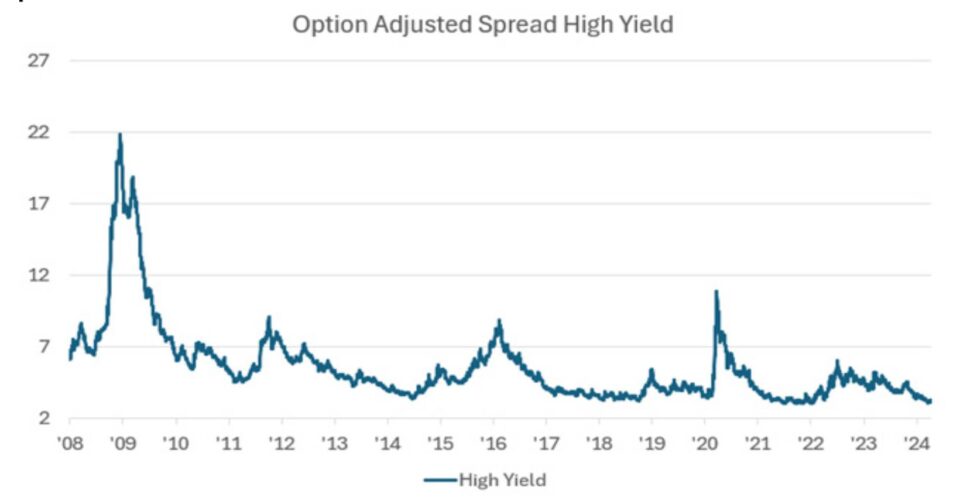
4. The difference between successful people and very successful people is that very successful people say no to almost everything,” Warren Buffett once said. Credit is one area where we are universally cautious. We have found a few pockets of credit that appear to offer strong risk-adjusted returns over the cycle, but that is the exception. As you can see, spreads are near decade lows, which means on average, the amount of return for the risk taken is low. While we do not have clear data on the private market, we do know that the crossover market and many of the direct lending markets compete
directly with the syndicated market. As a result, we can assume that spreads are similar.
Shown below is the option adjusted spread between high yield bonds and treasuries for the same duration, today one is not getting compensated for taking risk in credit vs history
In the spirit of AI, I have asked the Perplexity AI app powered by GPT-4 to write the summary:
“The document discusses the exceptional post-pandemic performance of the US economy, highlighting its resilience and growth in sectors like AI and biotech, despite challenges such as inflation and fiscal deficits. It raises questions about the sustainability of such growth, referencing historical forecasts and the current investment landscape. The analysis suggests cautious optimism, advising a balanced approach to investment, particularly in leading US companies, short-duration bonds, and sectors benefiting from AI. It also emphasizes the importance of being prepared for various economic scenarios, reflecting on the unpredictability of market trends and fiscal policies.”
Not bad, couldn’t have said it any better myself.
MEMORANDUM DISCLOSURES & DISCLAIMERS
This Memorandum is confidential and may contain legally privileged and proprietary information of Twin Focus Capital Partners LLC (“TwinFocus”). It is intended solely for the use of the Recipients to which it is addressed. If you are not the intended recipient, you are hereby notified that any dissemination, copy, disclosure, use or action taken based on this Memorandum is strictly prohibited and may be unlawful. If you received this Memorandum in error, please contact the sender immediately and destroy the material in its entirety, whether electronic or hard copy.
This Memorandum may not be otherwise redistributed, retransmitted or disclosed, in whole or in part, or in any form or manner, without the express written consent of TwinFocus.
Investments involve numerous risks, including, among others, market risk, counterparty default risk and liquidity risk. In some cases, securities, strategies and other financial instruments may be difficult to value or sell and reliable information about the value or risks related to the security, strategy or financial instrument may be difficult to obtain. Income from such securities, strategies and other financial instruments, if any, may fluctuate and the price or value of such securities, strategies and instruments may rise or fall and, in some cases, investors may lose their entire principal investment. Foreign currency rates of exchange may adversely affect the value, price or income of any security or financial instrument mentioned in this Memorandum. Investors in such securities and instruments effectively assume currency risk.
Hedge fund and other alternative investments are generally unregulated and considered inherently very risky and you can lose material portions of your principal in very short periods of time. Prior to making any investments in any hedge fund managers and alternative investment strategies, you should thorough review all subscription documents and confidential offering memoranda provided by the managers/strategies, paying particular attention to the risk disclosures. You should not invest in such managers/strategies if you are not thoroughly comfortable with these risk disclosures or do not understand and/or appreciate the increased levels of risks associated with such strategies. Additionally, this Memorandum may provide information regarding private funds/strategies/investments which are exempt from registration under the Investment Company Act of 1940 pursuant to Section 3(c)(1) and/or 3(c)(7) which were offered as private placements in reliance on Regulation D of the Securities Act of 1933. Each individual fund/strategy and NOT TwinFocus shall have the sole responsibility for (i) formally qualifying prospective investors to ensure they meet the suitability criteria to invest in each relevant fund/strategy and, once qualified, (ii) sending the formal offering documents and other materials to each prospective investor.
Any information relating to the tax status of financial instruments and/or strategies discussed herein is not intended to provide tax advice or to be used by anyone to provide tax advice. Recipients are urged to seek tax advice based on their particular circumstances from an independent tax professional.
Any waiver by TwinFocus of any section of this Memorandum Disclaimer Statement should not be construed as a general waiver of any other section and/or the entire Memorandum Disclaimer Statement.
The information, including but not limited to forecasts and estimates, in this Memorandum was obtained from various sources and TwinFocus does not guarantee its accuracy. Although the information contained in this Memorandum is from sources believed to be reliable, no representation or warranty, expressed or otherwise, is made to, and no reliance should be placed on its fairness, accuracy, completeness or timeliness.
This Memorandum may contain multi-year financial pro forma planning projections, predictions, return assumptions, as well as other financial, legislative, statutory and client balance sheet assumptions that are for illustrative purposes only and no representations or warranties, expressed or otherwise, are made to, and no reliance should be placed on their fairness, accuracy, completeness, or timeliness.
Past performance is not indicative of future results and there can be no assurance that the future performance of any specific investment, investment strategy, or product will be profitable, equal any corresponding indicated historical performance level(s), be suitable for client portfolios or individual situations, or prove successful. Due to various factors, including changing market conditions and/or applicable laws, the content may no longer be reflective of current opinions or positions. As such, all opinions, projections and estimates are as of the date of the Memorandum and are subject to change without notice. TwinFocus is under no obligation to update this Memorandum and Recipients should therefore assume that TwinFocus will not update any fact, circumstance or opinion contained in this Memorandum unless specifically requested. TwinFocus and any director, officer or employee of TwinFocus do not accept any liability whatsoever for any direct, indirect or consequential damages or losses arising from any use of this Memorandum or its contents.
This Memorandum may contain current opinions of third-party authors and not necessarily those of TwinFocus. Such opinions are subject to change without notice. This Memorandum may contain references to market indices. Such information is presented to show general trends in certain markets for the periods indicated and is not intended to imply that the strategy(s) discussed and/or reviewed are similar to the indices either in composition or element of risk. TwinFocus does not make any representations as to whether the indices may or may not be unmanaged, not investable, have any expenses and may or may not reflect reinvestment of dividends and distributions. Index data is provided for comparative purposes only. A variety of factors may cause an index to be an inaccurate benchmark for a particular portfolio/ manager/ strategy and the index does not necessarily reflect the actual investment strategy of the portfolio/manager/strategy discussed and/or presented in the Memorandum. Current period returns may be estimates. Actual index returns and/or estimates are calculated and presented to Twin Focus through third party software providers and as such, may differ from the final figures produced by the index provide.general waiver of any other section and/or the entire Memorandum Disclaimer Statement.

