

Echos of Bubbles Past: Q4 Market Signals to Watch
In each of our quarterly letters, we highlight what we believe is topical and relevant to our investment outlook and then go a bit deeper. This quarter, we are curious about historical investment bubbles and what they looked, sounded and felt like at the time. All bubbles are evident in hindsight, but few investors are aware of them at the time.
We also address several critical themes we believe will shape investment decisions over the coming few years:
- Inflation and tariffs…do they matter?
- Why the divergence in rates from Chinese rates and the Federal Reserve’s goals?
- What is the economy’s next move?
We conclude with our highest conviction recommendations for positioning across asset classes.
Are We in a Bubble Now? Lessons from Past Bubbles
Unless you are Eugene Fama, who has argued that bubbles do not exist, we have seen countless market bubbles since the dawn of investing.
The Tulip Mania in the Netherlands. The South Sea Bubble. The end of the Roaring Twenties (which helped spur the Great Depression). And more recently, the tech and telecom peak of 2000 (centered around marginally profitable companies supporting the internet build-out) and the housing crisis of the 2000s.
We find commonalities in all these bubbles — the most important being that in each of the five cases cited above, there was an underlying kernel of reality that drove interest and investment. Still, these realities were eventually distorted and amplified by speculative mania. Let’s break it down for each bubble, below.

Source: https://www.linkedin.com/pulse/exploring-tulip-mania-first-economic-bubble-its-shah-ca-cpa-pcjpc/
Tulip Mania (1630s).
One of the first documented “investment bubbles” in which tulip bulbs were exchanged at increasing value, similar to the “meme” stock moves of recent years.
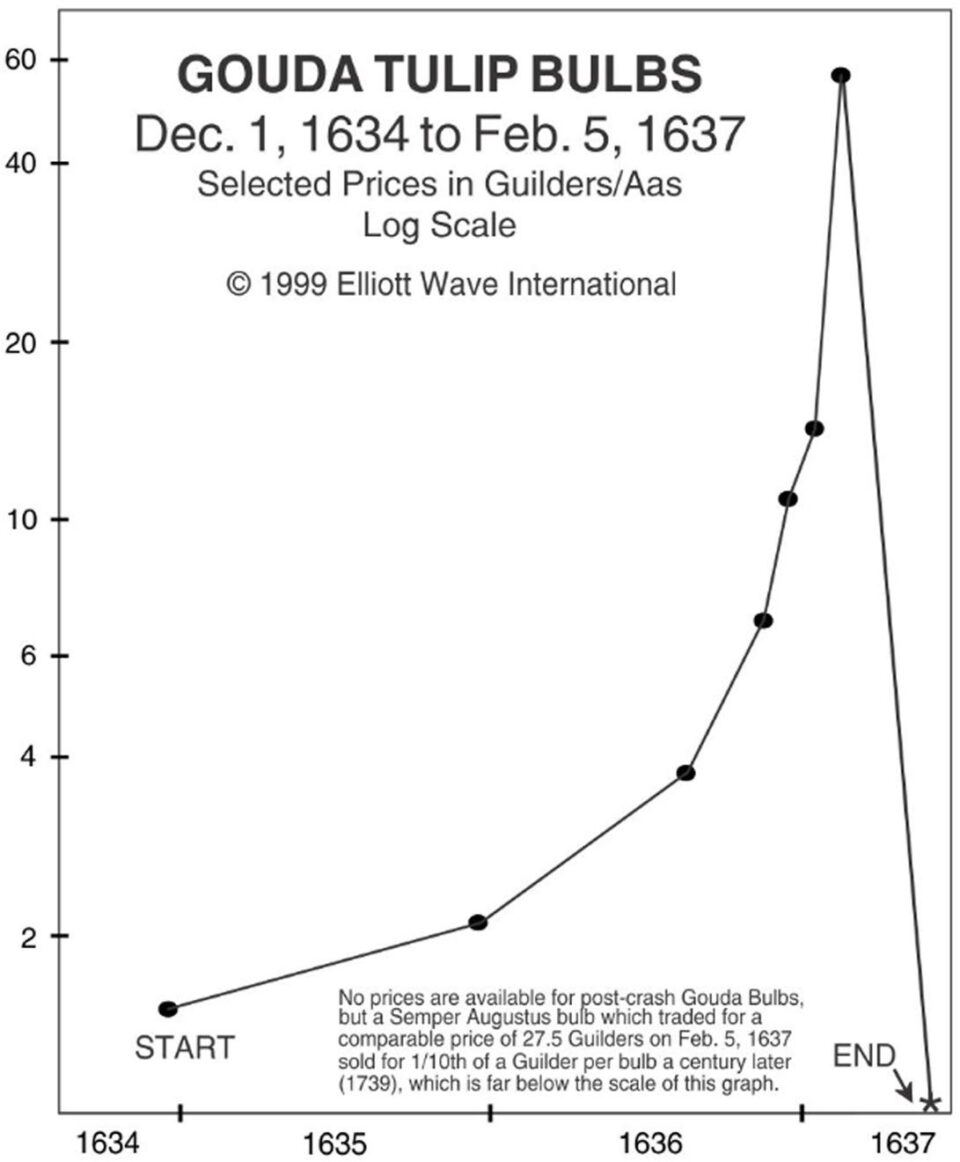
- Underlying truth: Tulips, particularly the rare “broken” varieties, were genuinely beautiful, exotic, and highly sought-after luxury goods, reflecting status and wealth. They possessed a real aesthetic and collectible value.
- What led up to it:
- Introduction from Ottoman Empire: Tulips were a novelty imported from the Ottoman Empire, making them exotic and desirable.
- Dutch Golden Age: A period of immense wealth and prosperity in the Netherlands created a wealthy merchant class with disposable income and a desire for status symbols.
- Horticultural skill: The Dutch were highly skilled in horticulture and developed techniques to cultivate new and beautiful varieties of tulips, effectively beginning the era of rapid genetic engineering.
- Rarity of “broken” tulips: The unpredictable and unique patterns of “broken” tulips, caused by a virus, made them exceptionally rare and valuable.
 Source: https://www.alamy.com/
1. South Sea Bubble (1720).
One of the first stock-based markets created to support the burgeoning trade in the South Sea.
- Underlying Truth: The world desperately needed technology and trade and the network of shippers and distributors was one of a kind.
- The rise of joint-stock companies: A new financial instrument that allowed for raising capital from multiple investors.
- Government sought solutions: The British government actively searched for ways to manage its debt burden.
- Treaty of Utrecht (1713): The treaty granted the South Sea Company a monopoly on trade with Spanish South America (although this monopoly was largely restricted in practice).
 Source: https://www.investopedia.com/terms/s/stock-market-crash-1929.asp
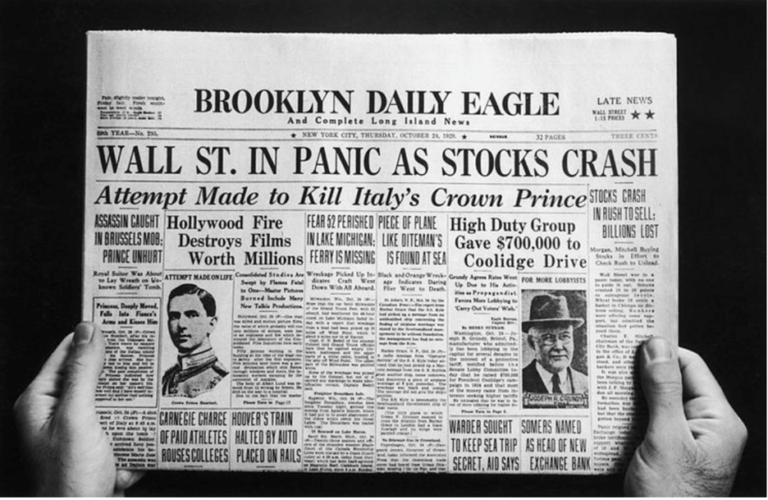
2. 1929 Stock Market Crash.
Massive broad-based market crash based on the confluence of new technologies and speculation.
- Underlying truth: The American economy experienced genuine growth in the 1920s, fueled by technological advancements, increased productivity, and new industries. Many companies were profitable and had solid prospects. The stock market was, in principle, a valid way for companies to raise capital and for investors to share in their success.
- What led up to it:
- Post-WWI boom: The US economy rebounded strongly after World War I and became a global economic leader.
- Technological innovation: New technologies like the automobile, radio, and electricity spurred economic growth and created new industries.
- Mass production and consumerism: The rise of mass production made goods more affordable, and a new consumer culture encouraged spending.
- Rise of the stock market: The stock market became increasingly accessible to ordinary Americans, offering the potential for significant returns.
3. dot-com Bubble (late 1990s)
- Underlying truth: The internet was a revolutionary technology that could transform communication, commerce, and many other aspects of life. Many internet-based companies developed innovative products and services with real value and long-term growth prospects.
- What led up to it:
- Development of the World Wide Web: The creation of the World Wide Web made the internet accessible and user-friendly for the general public.
- Rapid adoption of personal computers: PCs became increasingly affordable and widespread, providing millions with access to the internet.
- Growth of e-commerce: Online shopping and other internet-based businesses began to gain traction.
 Source: AP
4. Housing Bubble (2000s)
- Underlying truth: Homeownership is a core part of the “American Dream,” and provides stability, a sense of community, and a means of building wealth. A well-functioning housing market is essential for a healthy economy. Furthermore, there was a legitimate need to expand homeownership to underserved communities, and modern finance techniques lowered the cost of borrowing and mortgages.
- What led up to it:
- Low interest rates: After the dot-com bubble burst, the Federal Reserve lowered interest rates to stimulate the economy. These low rates made borrowing money for mortgages very attractive.
- Deregulation of the financial industry: The financial industry, particularly mortgage lending, experienced significant deregulation in the years leading up to the crisis. This allowed for the creation of complex and risky financial instruments. Restrictions separating commercial and investment banking were also loosened, further enabling risky behavior for lenders and borrowers alike.
- Subprime lending: Lenders began offering mortgages to borrowers with poor credit histories (subprime borrowers). These mortgages often had low initial “teaser” rates that would later reset to much higher rates.
- Housing bubble: The increased demand for housing, fueled by easy credit and speculative investment, led to a rapid increase in home prices, creating a housing bubble. Demand was simply greater than supply — until it wasn’t.
- Government policies: Government initiatives, such as those promoting homeownership and the Community Reinvestment Act, played a role, though the extent of their influence is debated. Some policies may have unintentionally encouraged lending to borrowers who couldn’t afford it long-term.
 Source: https://www.usatoday.com/story/money/2021/09/23/housing-market-crash-horizon-experts-discuss-possibility/8334866002/?gnt-cfr=1&gca-cat=p
Common Threads in These Bubbles:
While each was different, there are a few common truths we see in bubbles:
- Genuine Innovation or Opportunity. A new technology, market, or investment opportunity emerges with real potential for growth and value creation. Examples include the early stages of genetic engineering in tulips, the creation of the Internet, and the modernization of household finance.
- Early Adoption and Legitimate Growth. Early investors and adopters recognize the potential and invest, leading to initial growth and justified wealth. Early investors created the dream that led to a fear of missing out (FOMO) on the next big thing. In the 1990s, stocks like Intel and Microsoft were early winners, and investors extrapolated those successes to companies with limited revenue or those building telecom infrastructure. While there was tremendous growth, profitability often didn’t appear for a decade or longer (or ever).
- Low (perceived) Risk and High Liquidity. In each case, the potential risks had not been experienced or there was no clear precedence from which to draw lessons. Much like a learning AI agent, the market never makes the exact same mistake twice. There had been real estate crashes, but they were local and not on a broad national level. The Internet was a new global commercial and communication network while previous infrastructure buildouts (rail roads, telephone) were largely national in scale. While all cycles involve some new types of leverage, the perils of that leverage are largely discussed ex post.
- Increased Attention and Hype. The success of early adopters attracts more attention, and the media begins to promote investment opportunities. In the case of the Tulip Mania and South Sea Bubble, it was through word of mouth and stories of each success. In the 1920s, the opulence displayed by early investors was enticing for those who had missed out. In the 1990s, the day-trading boom was front-page news.
- Speculative Frenzy and Irrational Exuberance Lead to New Leverage Techniques Introduced. Narratives shift from the underlying fundamentals to the potential for quick profits. Speculation takes over, fueled by greed, FOMO, and a herd mentality. Some might call this a Ponzi scheme, but good Ponzi schemes often rest on a widely accepted truth. Exotic tulips were uniquely rare. Radio and automobiles revolutionized productivity in the 1920s. During the late 1990s, tech companies were seen as resilient growth engines despite an economic slowdown. Those participating are generally labeled villains afterward, but usually have real belief in the assets they promote. In 2006, for example, mortgage brokers had 50 years of data supporting their view that we had never had a national housing crisis, so pushing leveraged products was seen as having little risk.
- Distortion and Detachment from Reality. Asset prices become increasingly detached from any reasonable assessment of intrinsic value. Inherent in the definition of a free market is that assets will trade above and below fair value; our definition of a bubble is that very few possible financial scenarios support the current value. For example, when service companies, which generally have 15% margins over time, were trading near 100x forward revenue, it was clear that only the rosiest forecast could support the price.
- Bubble Bursts. A loss of confidence, a triggering event, or a realization that the underlying assumptions were flawed leads to a rapid price decline. In some cases, it was overnight, like in 1929; in other cases, like the housing crisis, it was a death by 1,000 cuts as the broader market slowly unraveled the size of the issue. In the South Sea burst, insiders began selling ownership as their confidence weakened. (Note: today, corporate insiders are selling…)
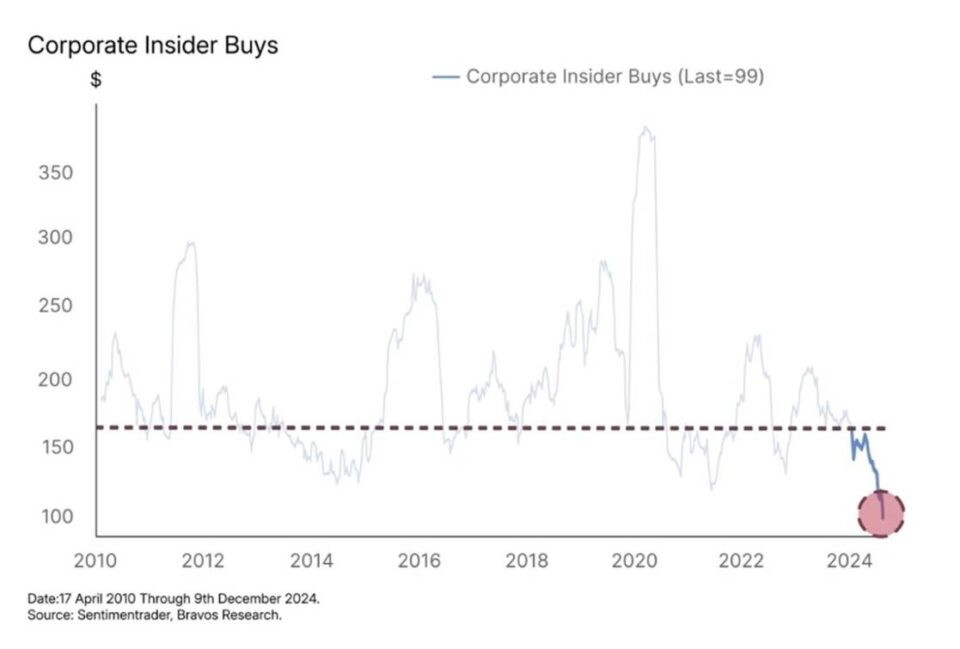 Source: Sentimentrader, Bravos Research
If We Were in a Bubble Today, What Might History Books Write About It?
As George Soros famously said, “There is no idea so large that Wall Street can’t ruin it.”
Wall Street, or the masses, frequently distorts the value of markets, stocks, or concepts. The ideas can still be valid, but with a low cost of capital or too many entrants, the opportunity can be squashed, like what happened with the telecom build-out for the internet. The internet’s growth never slowed; the issue was simply that “Wall Street” built too much capacity.
So, if we were just asking for a friend… what might these be the markers if we were in a bubble related to AI and its investments?
Genuine innovation – Check.
The underlying story of AI and the potential for significant improvements in productivity for select areas of the economy is likely.
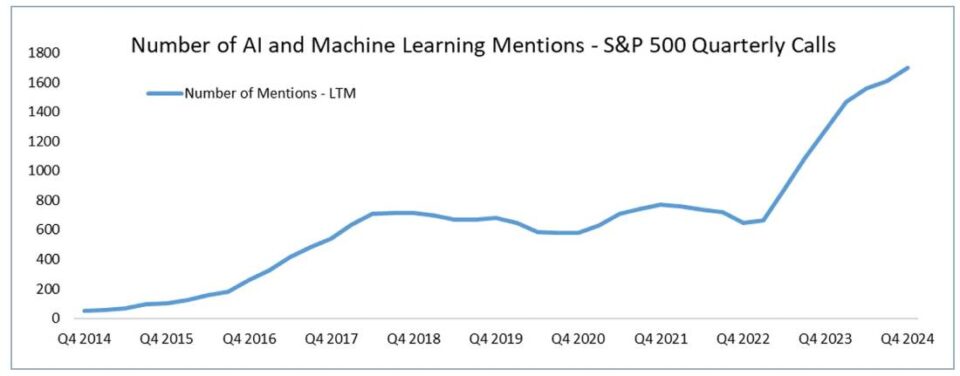
Early adopters and growth are abundant and obvious to everyone – Check.
We have that, and a topical look at quarterly conference callsshows that every management team wants to use AI.
Risk is perceived as low – Check.
While there were early apocalyptic prophecies, these have faded as the adoption of ChatGPT is years ahead of other technological innovations, while the implications of other innovations for labor, society and markets are different in nature and provide only a high-level view of potential risks.
Increased attention and FOMO, as expressed by investor optimism – Check.
We have considerable evidence that this is the most speculative market as measured by flows, positioning, and sentiment over many decades. This does not mean we have a bubble, but rather that the burden of proof is much higher today than last year or the year before.
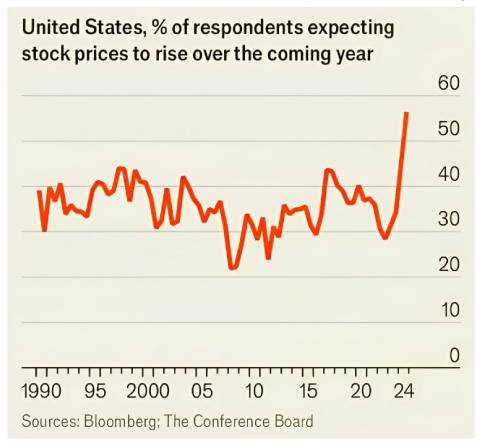 Sources: Bloomberg, The Conference Board
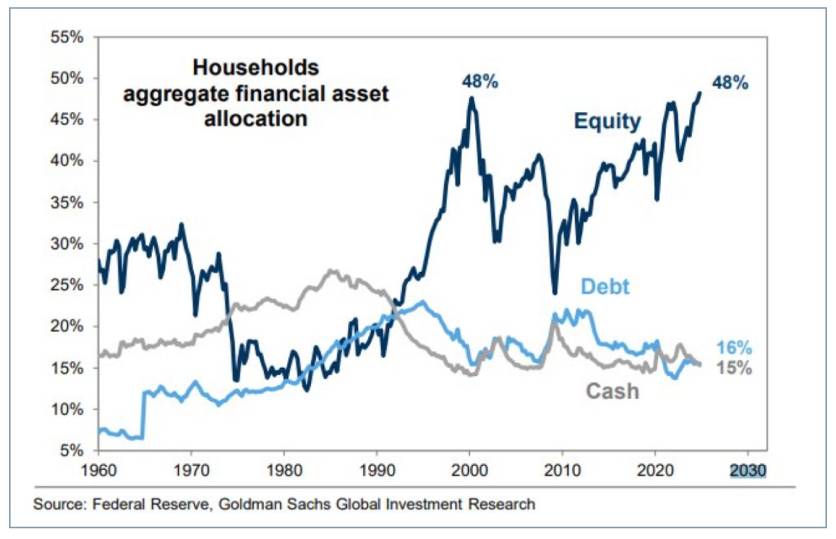 Source: Federal Reserve, Goldman Sachs Global Investment Research
Speculative frenzy – Check.
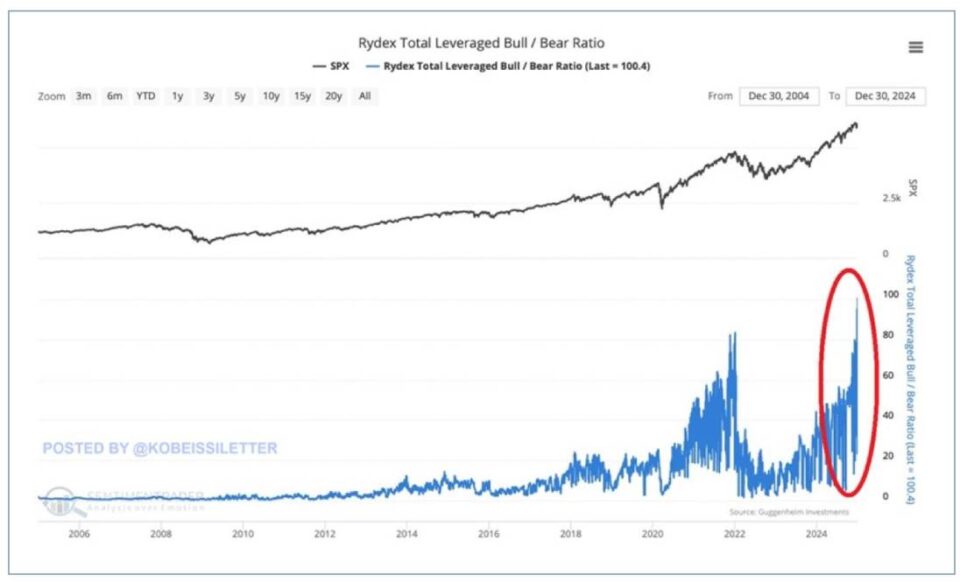
This is more obvious ex-post, as Warren Buffet says, “You don’t know who is swimming without their bathing suit until the tide is goes out.” However, if we are in a bubble, the double-levered ETFs, enormous one-day option creation, and stories like MicroStrategy, which is using leverage to buy a speculative asset, could become obvious villains from heroes today.
This chart is likely the best measure of liquidity and/or investor mood, demonstrating the enormous positioning to leverage in large asset classes. It shows 100X more levered long than short ETFS, which is expected to increase in an up market. However, the ratio is now making new highs. Not shown are traditional measures of optimism, put/call, futures positioning, and investor sentiment — all are in the 90th percentile of optimism.
Above fair value estimates – Check.
While the public markets have less gearing than usual, private markets and NAV loans, which are based not on profits but rather on the estimated value of growth assets, will likely be prime culprits to create a housing-like doom loop, where leverage is reduced to pay off current problems. So far, we have generally kicked the can down the road on unprofitable and private firms through numerous financial innovations; time will tell if these are innovations or, like the mortgage crisis, something where risk was mispriced.
Triggering event – To Be Determined.
Our recollection of the late 1990s was that most in the semiconductor supply chain were wary in December 1999, and there was double and triple ordering to support the dream. We have already seen double and triple ordering this cycle through the prebuild of semiconductor fabs and enormous power center and data center buildouts. Might the demand for these be less than investors expect? Shown here are effectively the fiber needs of 2000. In 2000, the building blocks for the Internet were telecom fiber capacity buildouts. Today, the buildout is power to feed the data centers to run AI. Below is the staggering demand increase “forecast” for the next couple of years.
Our view is that we are likely in the early stages of forming the bubble. While the valuations of some of the major beneficiaries still appear reasonable, their massive investments could prove to be mistakes. At the very least, we may be overbuilding. The free cash flow that once blessed these profitable monopolies is now largely being spent on a future dream, which today is unknown.
We still like our cocktail of pick-and-shovel AI players, like utilities and MLPs, but we are cautiously studying the data to see if there are any signs of excesses.
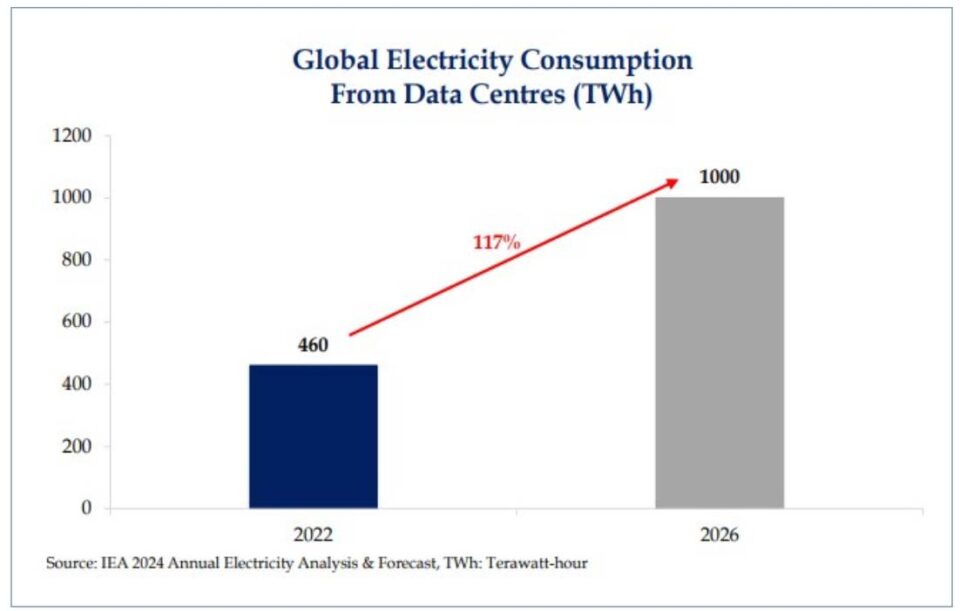 Source: IEA 2024 Annual Electricity Analysis & Forecast, TWH: Terawatt-hour
Tariffs?
As Yogi Berra wisely quipped, “Nobody knows nuttin’”. The wisdom we take from that at TwinFocus is that we are generally better off realizing what we can and cannot know and predict, rather than making what will likely be biased forecasts.
In the case of tariffs, they may curb job losses, as some Republicans assert, but they also introduce inflationary pressures, a concern often raised by Democrats. Both perspectives have merit.
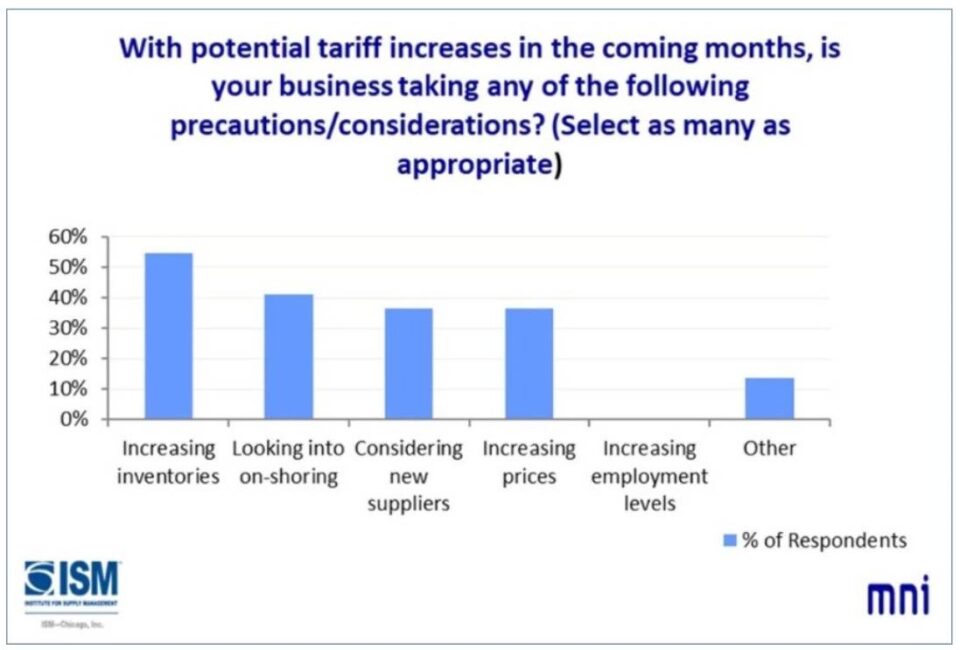
Our analysis of countless letters and analyses of experts suggests that tariffs, on balance, are inflationary. By diverting production from the most cost-effective regions, they raise costs, which are often partially absorbed by manufacturers, ultimately weighing on profit growth in affected industries. Additionally, it’s possible the threat of tariffs has pulled forward shipments into the U.S., creating an inventory bump that will need to be worked off once the outcome of tariffs is known.
But in the spirit of Yogi, we won’t know until we know, and it is also possible the nominal growth and employment gains that result from potential tariffs means that this won’t be the biggest effect on the 2025 markets.
The Case of Market Outlooks
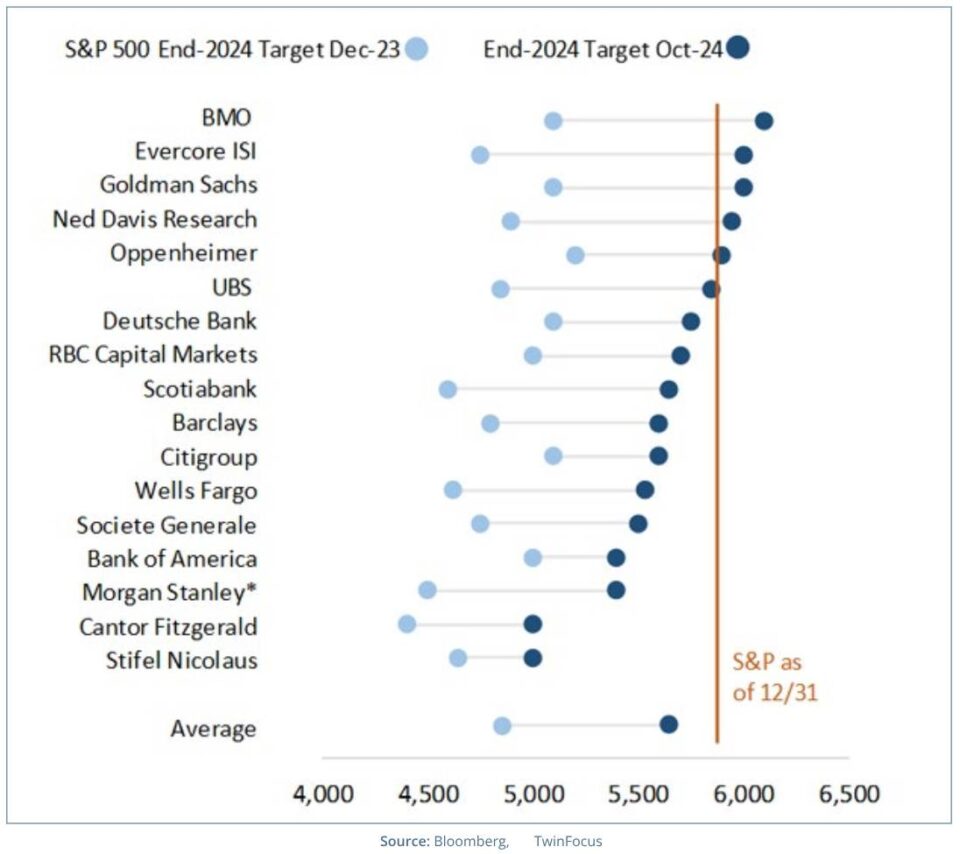
First, let’s start with the view of the “supposed” experts on the markets and the economy, as well as sell-side strategists. We do not mean to pick on them — the business of making explicit forecasts is generally a losing game. As Niels Bohr said “It is difficult to make predictions, especially about the future.” Forecasts are also generally anchored to past moves in the market; see the chart below. On average, analysts dramatically raised their forecasts with the surge in the market in early Q4.
 Source: Bloomberg
After watching Wall Street for three decades, this does not surprise us at TwinFocus. Are they correct with their forecasts today? Probably not. Were they right last year? Tom Lee at Fundstrat, generally considered by many as a perma-bull, was the most accurate; he correctly forecasted no recession. With hindsight, which was a particularly brazen call as most of the world entered some type of slowdown, but the U.S. was immune — except for a slight slowdown in job growth in Q3, there were very few signals of an impending slowdown.
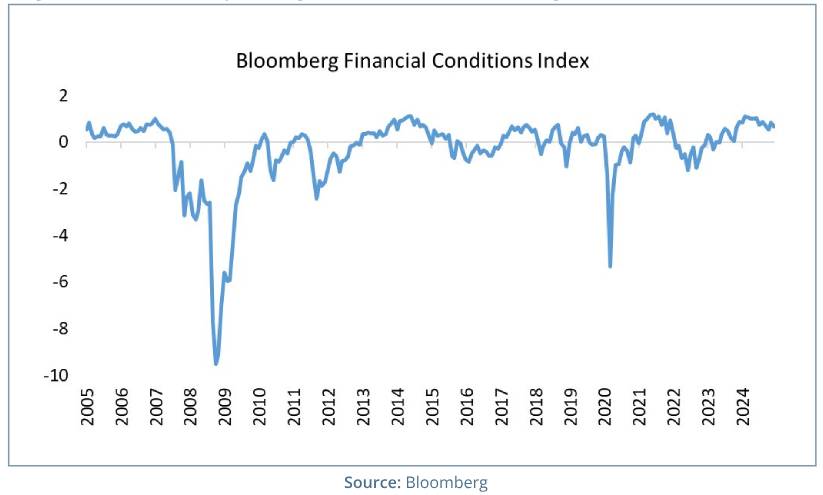
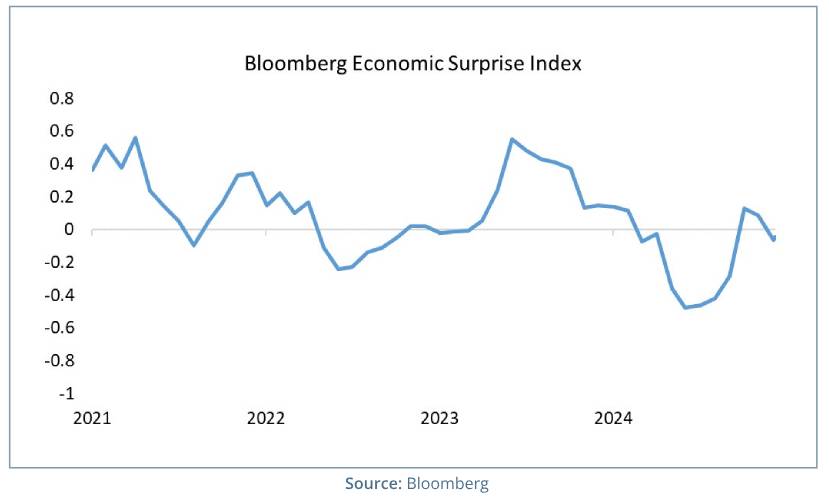
It is not surprising that most economists are quite optimistic for the coming year, especially after the apparent resilience of the U.S. economy. Taken together the two charts below tell a simple story: Financial conditions are wide open, this typically leads to faster earnings growth in a couple quarters, our hunch is that the financial conditions are enough to lift economic surprise to positive territory in Q1. Taken together, the last thing the Fed should be doing is aggressively cutting rates; it appears they got the message.
 Source: Bloomberg
The areas we worry about, though, are twofold. One, the large fiscal impulse in 2024 helped the economy grow; Goldman Sachs estimates it added about 100 bps to growth last year, but their estimates are just that we lap these compares in 2025, and the impulse is less, without a major spending bill. Second, as we wrote last year, US consumers, propelled by a staggering wealth effect in housing and the markets, continue to spend more than they make; this is in some ways similar to the drawdown in prior earnings done by those taking out larger and larger balances from HELOCs in the 2000s.
If we are to have a recession, charts like delinquencies will matter more. While, on average, the U.S. consumer is flush, the bottom decile consumer is strapped. These values were present before we saw the impact of tightening credit conditions for those behind in student loan payments. According to the Government Accountability Office, 10 million, or 25% of student loan borrowers are currently seriously delinquent. The ending of the payment delays in January will impact these borrowers unless the Biden forgiveness plan is extended under Trump.
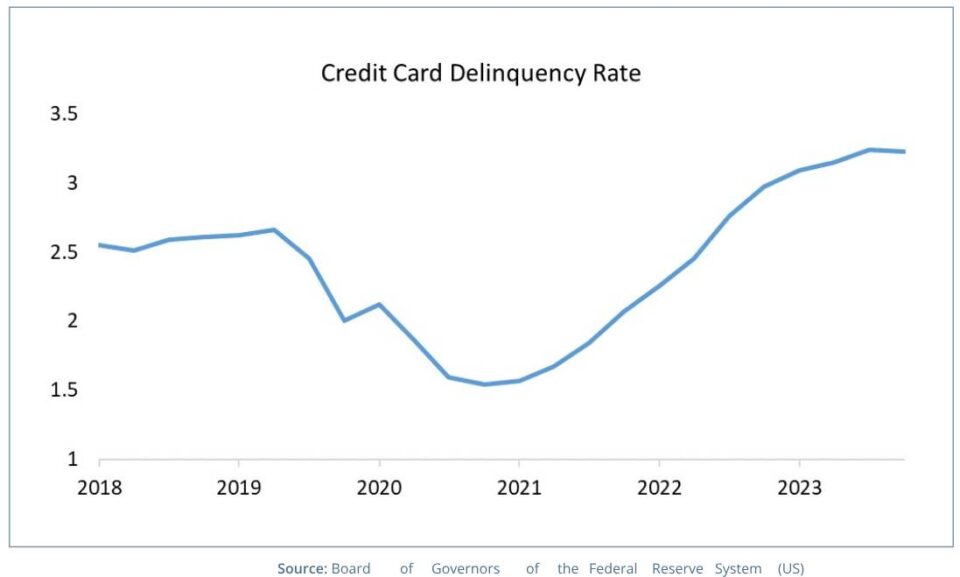 Source: Board of Governors of the Federal Reserve System (US)
Is the Fed in a pickle? Did the Fed make one of its most significant mistakes on record? Or is the market just optimistic?
Since the Fed started cutting rates in September, long rates are now up almost 100 bps, clearly the opposite of what they intended.

We believe there are at least three reasons for this strong move in rates:
1. The Fed was just too dovish in September, and a reasonable person might have believed the cuts were not needed. We wrote about this here. We take a small victory lap — as with hindsight, the large cuts were not needed, and the Fed was being uncharacteristically dovish. The cynic might believe the cuts were politically motivated, as little in the economy supported the dramatic cuts.
2. Real rates have moved up strongly, and there are indications of stronger economic conditions, both in response to tax cuts (which are pro- growth) and the continued strong economic conditions, as discussed earlier.
3. The last reason is subtle, but our largest current account deficit partner, China, is also our largest creditor nation. Through gold purchases and recent bond issues, they have made it clear that they will demand fewer treasuries. While it’s not the whole story, it’s apparent that they want their rates lower to help stave off an evident housing crisis. The reduction in their demand and increased supply from the Yellen and Treasury decisions will create a supply/demand imbalance. Shown below is the stark move in rates over the past 2 years
China and the US (not shown but the rest of the G7 also debtor nations would look more like the U.S.)
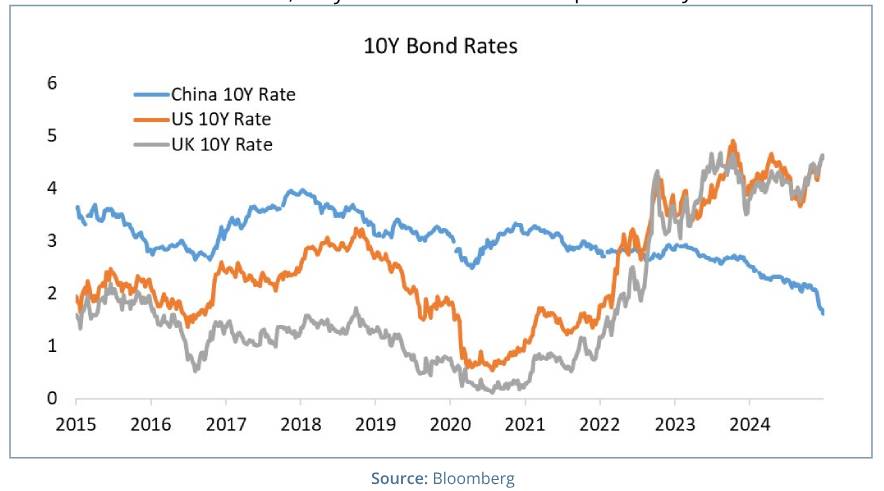 Source: Bloomberg
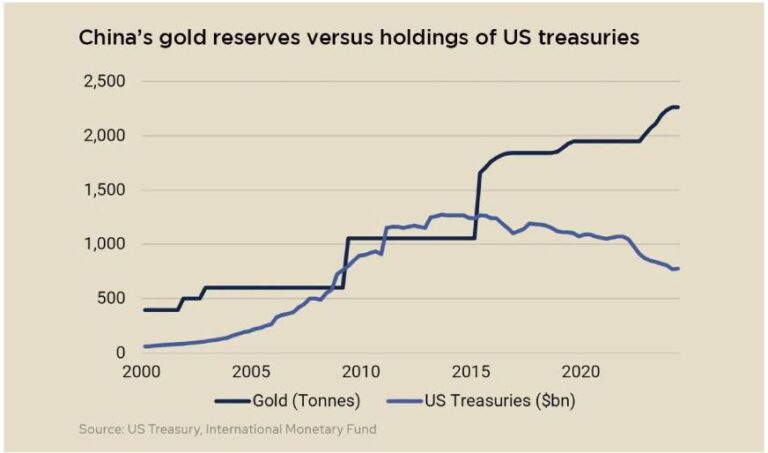 Source: US Treasury, International Monetary Fund
Is inflation still a problem?
While the Fed and most of the media have moved away from inflation as a pressing issue, we believe all portfolios should continue to have some protection from inflation. Based on a topical read of inflation statistics, it appears inflation will revert but to a higher mean. We can all debate whether we will gracefully go from a 2% target to a nice soft 3% target, or something more dramatic. We wrote about the follies of modern monetary theory here.
Our view is quite simple: with the massive amount of fiscal money printing in the U.S., inflation is not everywhere, but in areas where there is a bit of excess demand vs. supply, the prices go much more parabolic than in prior periods. One extreme example — the luxury handbag industry is benefiting from tight supply vs. demand, and the price of a classic flap Chanel bag has doubled since 2019! The same could be said of Bitcoin!
Our point is that monetary debasement impact on inflation is not a linear rise but rather a bumpy one that is indicative of goods that are in short supply, going up in price in ways never seen before. The > 6-standard deviation move in cocoa is clearly eye-catching, as are the recent strong moves in gold, corn, and natural gas.
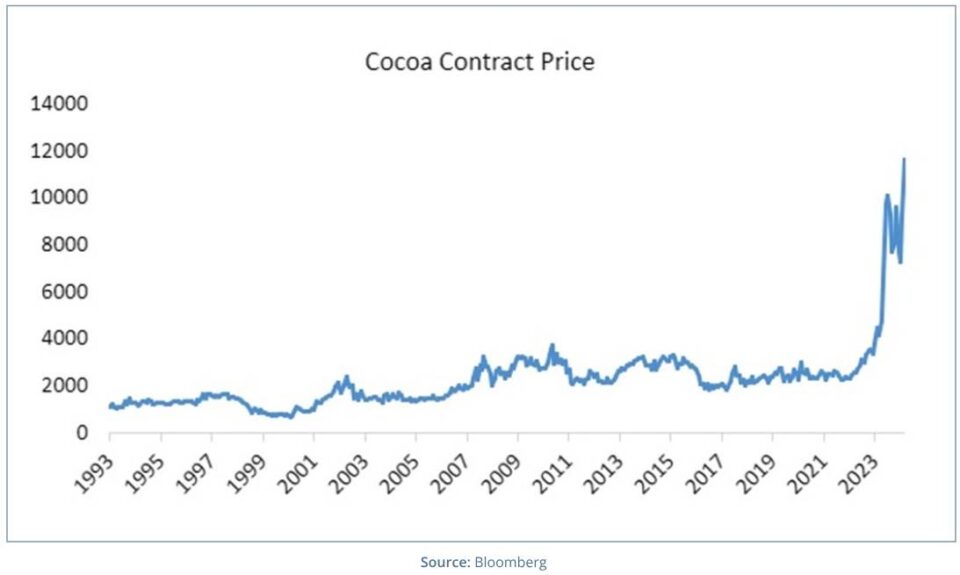 Source: Bloomberg
Recession in the U.S.?
Our longstanding view—that consumers cannot sustain spending beyond their income indefinitely—has been challenged by recent economic dynamics. Rising asset values have bolstered consumer confidence, enabling wealthier households to draw on savings and maintain spending levels.
Rather than continuing to forecast (with our bias) a looming recession, we are introducing our proprietary recession indicator, which includes the best assessments from economists over time and some qualitative judgment. The indicator is not fail-safe, but seeks to at least tell you when you are in a recession a quarter or so before traditional metrics like GDP are reported.
At this point, the indicator is elevated but still in the safe zone at 30%. This is not the estimated probability of a recession, but rather a percentage of the signals triggered. We have overlayed BBB spreads, which, over time, have indicated a recessionary environment by a quarter or two ahead on average. The one exception was in the late 1990s when credit markets were worried before the Nasdaq peak.
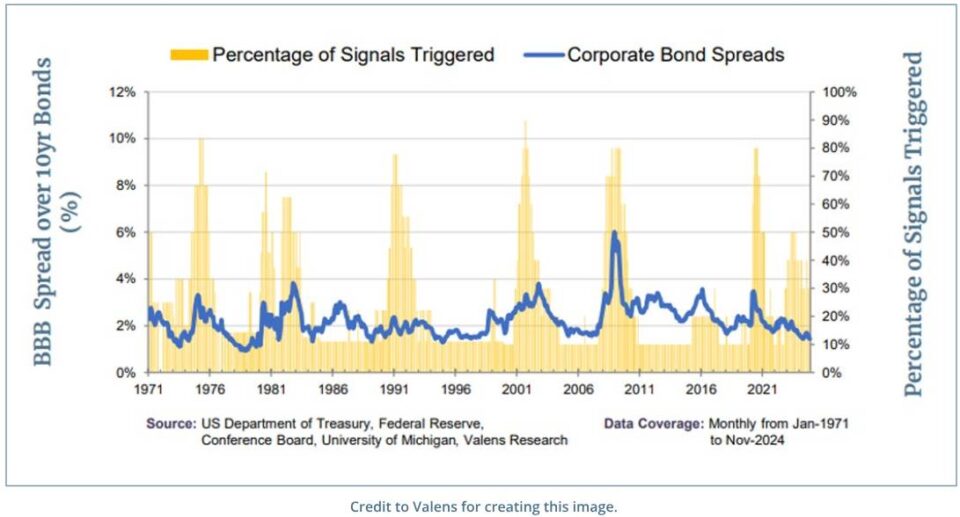 Source: Credit to Valens for creating this image
TwinFocus Key Positioning:
1. We continue to be skeptical of Private Equity as an asset class and are highly selective on private/structured credit. We wrote a paper on this topic… the message is simple: returns will be lower going forward due to the high starting point on valuations. We understand that the
strong move in public assets will open up windows for private equity and venture capital to sell assets in the public markets, but we are skeptical that it will clear the cycle.
2. We believe all diversified portfolios should have some exposure to precious metals (or Bitcoin if the volatility is sized correctly) as an asset class. See our prior notes on this here. Both are different hedges on a slow debasement of currency assets globally, which we
believe will persist.
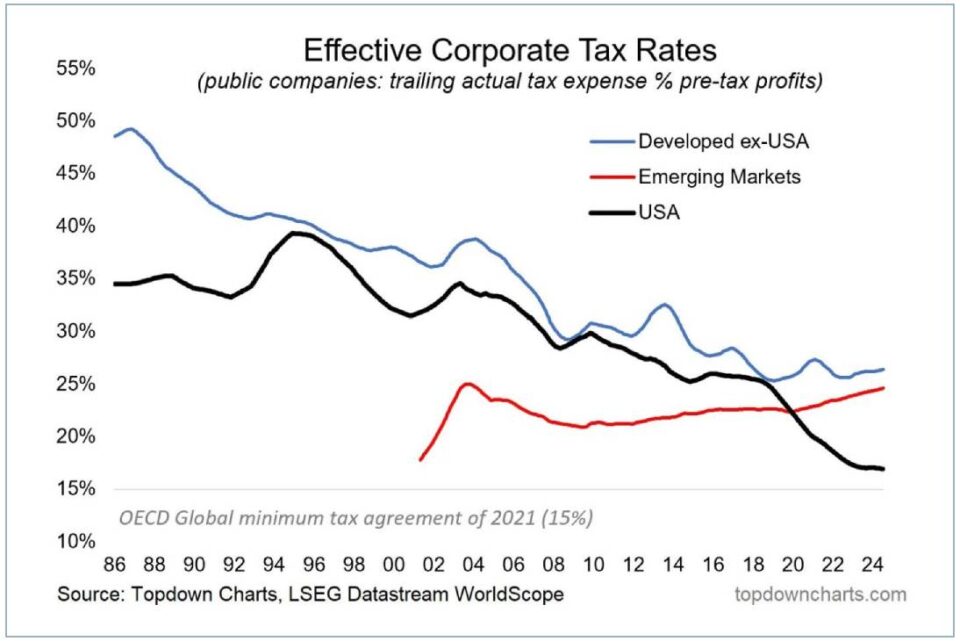
Our view is that while the Department of Government Efficiency may have some merits, the odds of significantly reducing debt are unlikely. This table shows how difficult it is to make a dent in the deficit without tackling entitlements. The following chart shows the staggering lowering of corporate tax rates from U.S. corporations over the past couple of decades. Globalization has clearly reduced corporate taxes as global and multi-national companies have been able to find the best tax strategy consistently – accessing the cheapest labor and capital while maneuvering taxable profits to the most tax efficient jurisdictions. However, countries across the world are taking aggressive action in eliminating these tax havens.
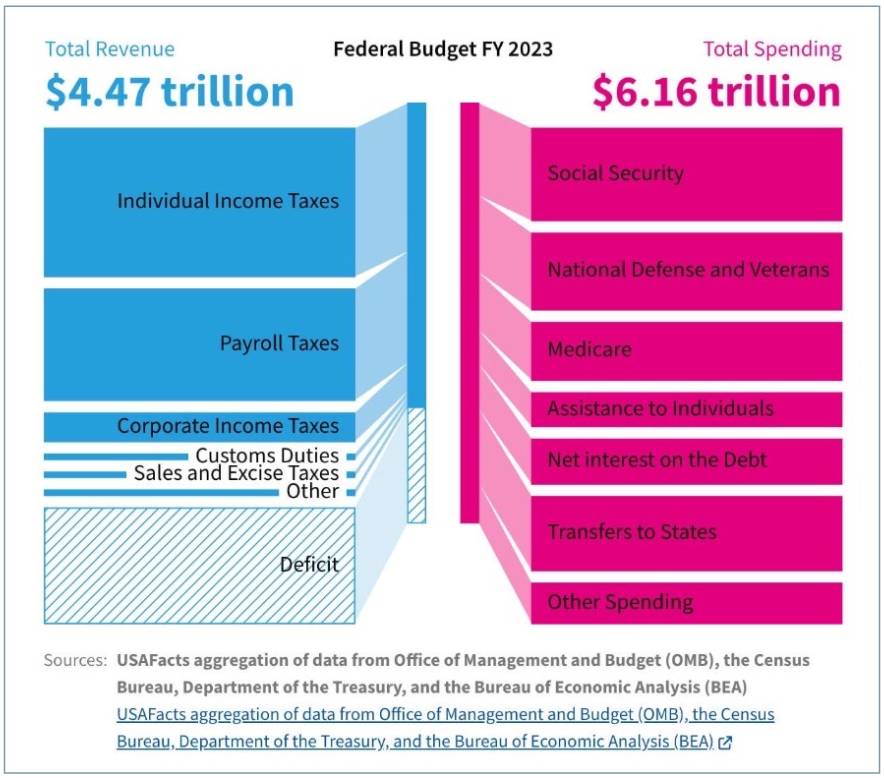 Sources: USA Facts aggregation of data from OMB
3. We believe investors should stay short to get long-term rates. In other words, there is likely more room to rise for longer duration rates, with investment returns at or below-stated rates.
4. We continue to like our plays on the pick-and-shovel winners from the AI boom. Our boomerang play on the AI buildout has been natural gas, and at least recently, we have been proven right. We believe that the only way to rapidly build out power generation in the U.S. and abroad is through combined-cycle natural gas plants. We are not making an environmental statement here; we are only saying that rapidly adding power supply in most of the world is the most expedient.
A few items have broken in our favor post-election as well:
o A colder winter than the last few in the Northeast, which is gobbling up excess inventory.
o Clarity on LNG buildout with Republican wins in the recent election.
o Continued pressure on the price of oil, which reduces shale drilling and associated natural gas from Permian drillers.
o A global view is coalescing that diversity in energy supply is smart geopolitics—generally, LNG from the United States shale is viewed positively in the Eurozone as a fuel source.
Natural gas has been the “widow maker” trade of the past two decades, as constant calls for improvement in supply and demand have been met with either regulatory delay in LNG or continuing supply in associated gas. We believe it is different this time.
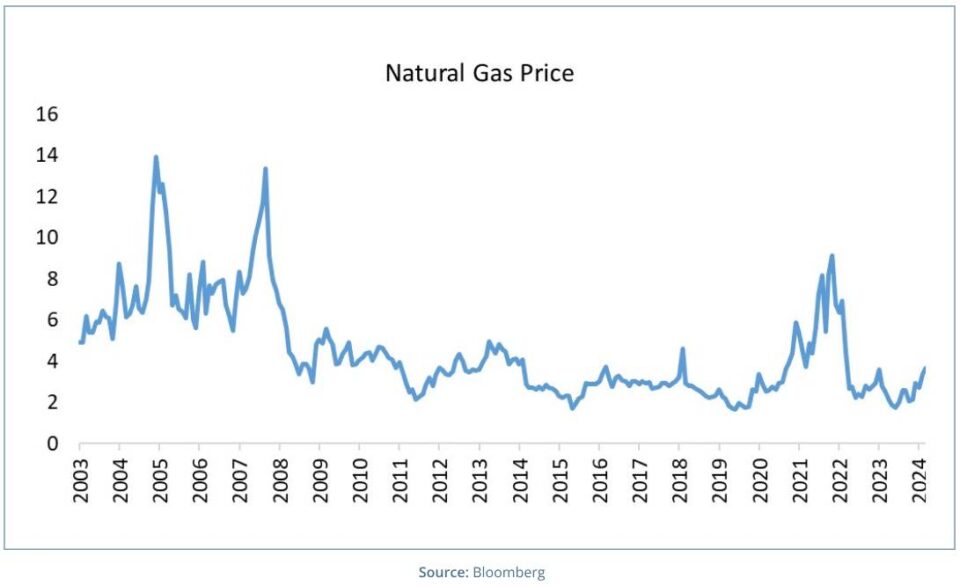 Source: Bloomberg
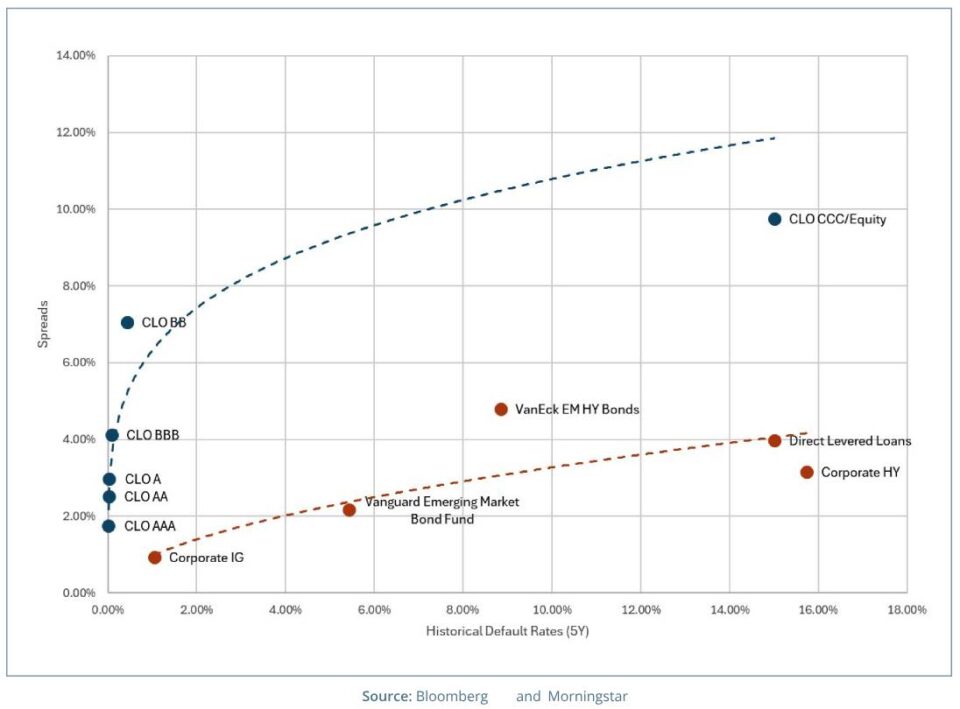
5. We have been early in calling the peak in credit globally. However, we still believe that investors are better served in markets other than corporate credit with spreads near generational lows. If an investor must seek yield, we recommend CLOs over traditional credit markets.
6. Taxes are in vogue. We are excited about some novel approaches to funding strategies with appreciated securities, thereby delaying eventual tax payments. We also believe that, like qualified opportunity zones during the Trump administration, the tax breaks given to investors in alternative energy have the potential to have robust after-tax returns.
 Source: Bloomberg and Morningstar
 Source: https://www.killerstartups.com/stock-market-outlook-for-2025-remains-cautious/
Summary
With figures like Michael Saylor dominating financial headlines and the prevalence of stock tips from casual investors, such as Uber drivers, we believe it’s highly probable that we are experiencing some form of bubble. While the exact peak remains uncertain, we are closely monitoring for signals that echo previous periods of market exuberance.
Given current fiscal demands, ongoing trade tensions, and market positioning, we maintain that longer-duration interest rates have room to climb. As such, we remain cautious regarding most credit instruments, as the current risk-reward proposition for investors in these assets appears unfavorable.

