
3Q_2024 Quarterly Letter
In each of our quarterly letters, we highlight a topic we believe is underappreciated by the market and dive deeper into its implications. This quarter, we explore why gold investors are often disparagingly referred to as “bugs” and what that sentiment means for portfolio positioning.
We also address several critical themes we believe will shape investment decisions in the coming years:
- The major challenges facing China post-stimulus and the broader outlook for emerging markets.
- The main driver behind the overpredicted recession: the resilient U.S. consumer.
- The Federal Reserve’s limited options and whether we have seen the low in interest rates for the decade.
- With the economy slowing, are we heading for a hard or soft landing?
- The underperformance of tech stocks—and why our earlier insights on this trend have proven accurate.
We conclude with our highest conviction ideas on positioning across asset classes.
Gold Bugs vs. Stock Bugs: who is right?
If you call someone a bug, that can’t be a good thing. A requested summary of “gold bugs” from ChatGPT provides a direct link that explains that gold bugs tend to harbor conspiracy theories about the government or market manipulation. The term was coined in the 1930’s when trust in traditional investments waned. It is still alive today, as though favoring gold somehow makes you a person who believes in things with less than obvious proof or somehow believes in things that question the status quo. We are not in that camp; we just follow the data. The data leads us to an obvious conclusion — gold has proven its “metal” over many decades.
As many long-time TwinFocus clients are aware, we believe that gold is a reasonable and logical holding for any investor looking to improve risk-adjusted returns; the current status quo of larger and larger fiscal deficits funded by promissory notes ensures that gold will continue to have value as the antidote to this trend. While gold performs well during panics, as the cartoon suggests, there are other forces at work in addition to global uncertainty.
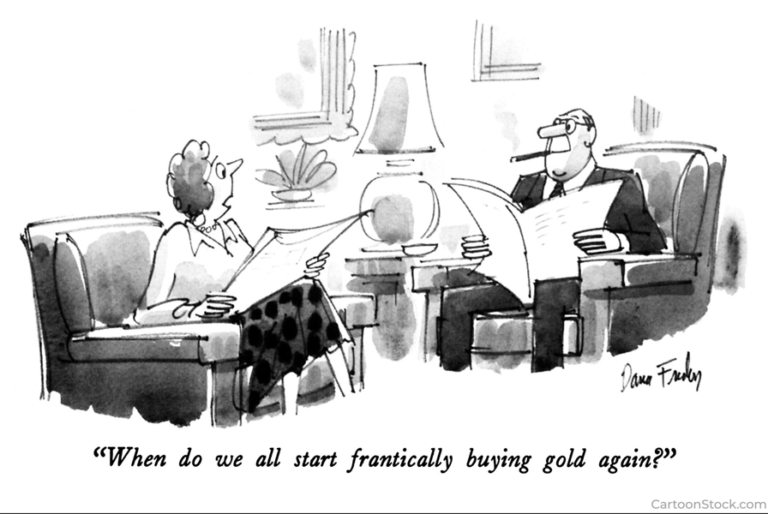
At gold’s peak in the 1930s, the world was awash in trouble, with a looming global war and a horrific recession. Not surprisingly, gold didn’t perform well over the next 50 years as the global tensions eased and currencies generally became more stable, not less. Said another way, it was a horrible investment after the term “gold bug“ was created.
Is gold a bug in a portfolio? Are investors who own gold crazy or believers in conspiracy theories? We believe not. They have reached a logical conclusion based on the common-sense appeal of gold given the current prices relative to mining costs and its 2000 year history as a store of value.
A brief history of gold. Gold coins were first minted in around 500 BCE in Lydia, now part of modern-day Turkey. Over time, cattle, barter, cowrie shells, furs, and even gigantic stones were all used as a form of money … shown below is an image of the Rai, which was a giant limestone disk used as currency on the island of Yap in Micronesia.

The one enduring form over time has been gold. Currencies have evolved, as has finance over time; we now use cryptocurrencies and real assets as sources of currency, so in some way, gold as a store of value is unique as many others have come in and out of fashion.
As a measure of who cares, the central bank’s ownership of gold as collateral against foreign currency reserves is shown below. We included Turkey to show that in general, countries with weaker currency controls generally hold more of their reserves in gold. While China is not as forthright as other central banks in reporting its reserves, based on recent data, they have been dramatically increasing ownership, as have Russia, India, and other OPEC nations, potentially as a hedge against reserves in dollars and treasuries. Gold reserves as a share of GDP have fallen dramatically. In the 1930s, gold reserves were close to 40%. Today, gold reserve levels as a share of GDP are generally 1 to 2%. A testament, at least so far, to the success of Bretton Woods II. As highlighted later, most central banks have reversed that trend in the past couple of years.
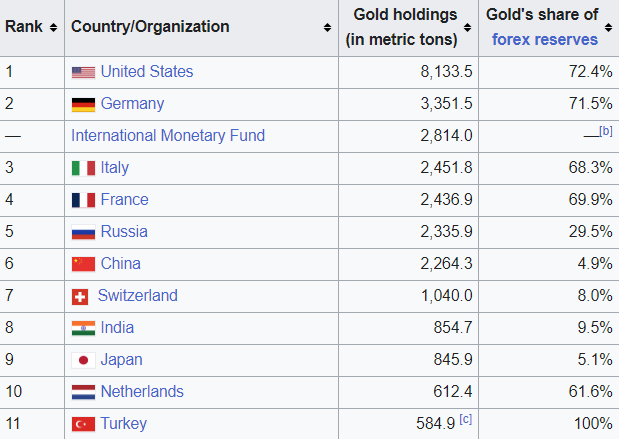
Source: Wikipedia
So why do we care about gold bugs today? Well, the story is quite simple. Gold has not only been a fantastic hedge for 25 years but also a stable and robust investment, and yet only some seem to care, as measured by traditional flow metrics.
We understand that people have loved stocks over time, especially those owning larger cap companies in the U.S. that have performed well since the early 1990s. We don’t call people who buy and hold stocks like Warren Buffett “stock bugs;” we call them smart or just simply those who have figured it out. Interestingly, though, there were three 20-year periods in the 1900s when stocks lagged bonds. From March 1999 through March 2009, the S&P 500 lost 2.2% annualized. We wonder, during those periods, what were long-term stock investors called? Stock insects? Today, they have all sorts of accolades, and the buy-and-hold approach to stock investing is considered a sure thing and is just apparent common sense. We only agree with the statement to a point. Also, since the 1990s, a period of rising stock market performance, rates have fallen consistently, and so have inflation expectations until recently, which has been a driver of some exceptional performance.
There are three fundamental truths that shape gold pricing and demand:
Truth 1: Gold’s price has historically tracked the value of currency over time. For instance, in 1934, a quality handmade suit cost around $30 and the price of gold was $34. Today, with gold priced around $2,700, roughly the same as a handmade suit crafted with U.S. labor costs. Of course, machine-made suits are available at much lower prices.
Truth 2: The Bretton Woods II era transformed the landscape. The turning point for gold came in the early 1970s when the world moved away from the gold standard, which tied a country’s monetary policy and balance sheet to its gold reserves. This shift gave rise to a more flexible system known as Bretton Woods II, named after the New Hampshire town, where this rethinking of global finance took place. The rationale was that governments should have the ability to create money as needed to address economic challenges and that de-pegging currencies from gold wouldn’t create major disruptions. Until now, this has proven true, as the world has functioned well without strict constraints on government spending. While there is room for debate on how sustainable this approach is, the dollar-based system unanchored from gold has generally performed better than the Bretton Woods I era, when governments and central banks had much less flexibility. In the 50 years leading up to Bretton Woods II, gold’s price was fixed relative to the U.S. dollar, set at $34 in 1934, but trading around $40 in 1971 at the dawn of Bretton Woods II. It wasn’t until the 1970s, when the U.S. dollar was allowed to float that gold began its dramatic ascent, a trend that continues today.
Truth 3: Gold typically trades at a premium to the all-in sustainable cost for the marginal gold mine, which currently sits around $2,000 per ounce. This cost often serves as a floor for gold prices, while the premium is influenced by factors such as central bank policies, inflation, and geopolitical risks.
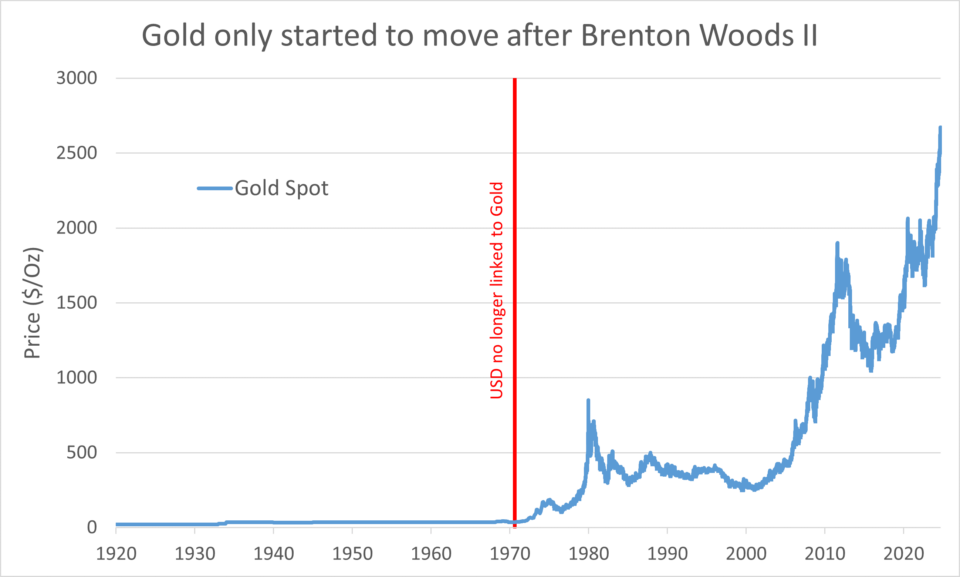
Source: Bloomberg
In fact, gold has outperformed even the best performing equity indices over the past 25 years, most notably during the sharp equity market drawdowns in 2008, 2018 and 2020.
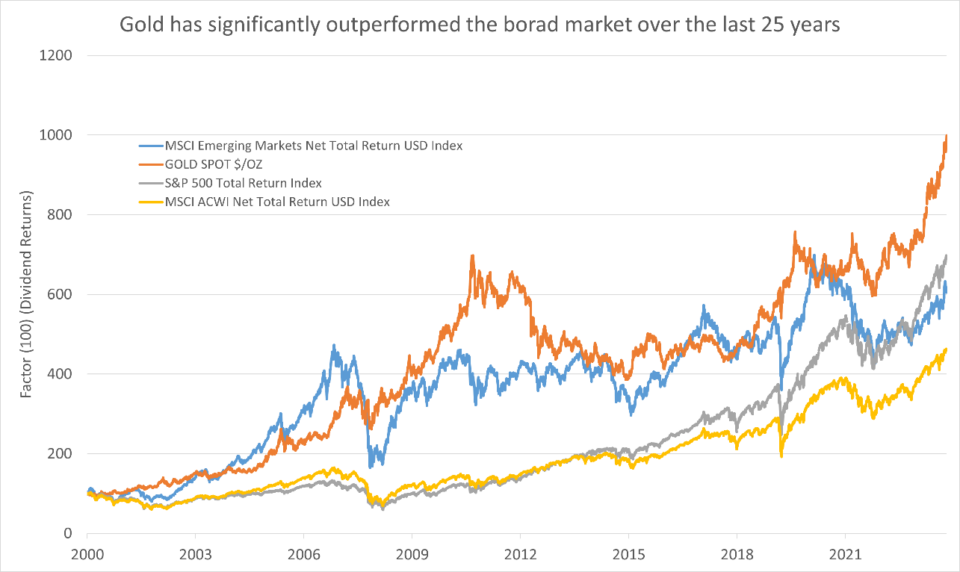
Source: Bloomberg
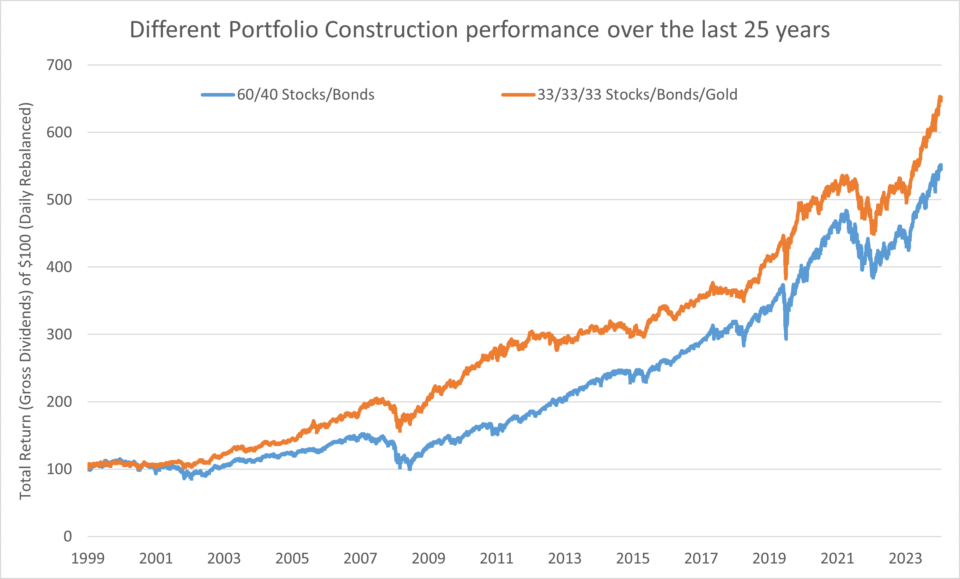
While returns from a 60/40 portfolio have been substantial, adding some gold to a 60/40 portfolio would have increased returns and lowered downside volatility… a win in our book.
Source: Bloomberg
The takeaway is obvious: the gold bugs have been right since 1998. That is a long time to live as a bug!
Taken together, one might think that most if not all allocators would have a solid allocation to gold; we find the opposite. We read Fisher’s investment advice as a proxy for a typical data-driven asset allocation model, and their quote is “Blunder #6…Buying Gold…most gold purveyors use fear and scare tactics…” They equate owning gold to a bet on Armageddon; we disagree…gold has been a stable source of value over many decades. We take offense to this view, which potentially may be consensus; gold has proven its worth over the last 100 or even 1000 years, and we suspect it will in the future.
Since February 2022, when the Ukraine war started, gold has had a startling run of 15% compounded, outperforming even defense stocks. Yet flows into the asset as measured by ETFs creation are negative.
We believe there are two reasons gold has not seen the attention one might expect after such a staggering run:
- Negative connotation based on historical experience and news flows from major asset allocators.
- Low volatility and connection to negative news make it a difficult asset to market.
So why has gold performed so well in the aggressive central bank age we appear to be in?
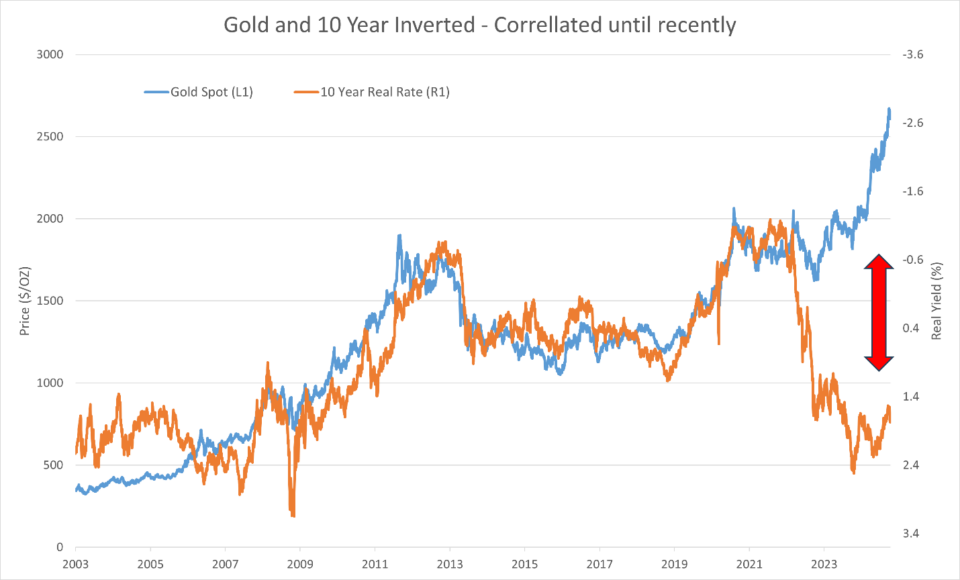
One reason is that gold loves low real rates; they lower the cost of carry. Gold provides no yield and typically trades in line with real rates over time. Shown below is gold’s performance against a measure of inverse real rates. There are deviations, but these appear to be a second driver of performance: expansionary government spending, which ensures a continuous need to suppress real rates. Over the last 40 years over 80% of the performance of gold can be explained by real rates, so the recent deviation that began during the Ukraine war and post COVID is significant.
Source: Bloomberg/FRED
Our take is quite simple: Gold is not a fad, bug, or a bet on Armageddon; instead, gold is a logical allocation in any portfolio. We can all argue about the correct sizing to optimize risk-adjusted returns. However, our simple nudge would be that if you believe central banks will be more active in forcing down rates in longer duration bonds and that governments will run larger and larger fiscal balances, then a position in gold is warranted.
If that is the case, why has gold performed so well in the last 18 months as real rates have risen? There are many theories to this; all have some semblance of truth.
- Since the United States and other NATO countries froze Russian assets in response to the war in Ukraine, most of the countries more allied with Russia than the United States have dramatically increased their gold stores and reduced holdings of treasuries. This makes sense as there is now a more rational fear that one day, these assets might be frozen as well.
- Gold is also anticipating future events. It is likely sniffing out that fiscal spending and yield control are likely to continue to grow under either a Democrat or Republican President. Over the past 40 months, the term premium for rates has been negative, the longest run on record, and a clear indication that rates have been depressed or “controlled”.
- We believe this is least important, but during periods of geopolitical turmoil, gold can appreciate from fair value. While there is more conflict in the Middle East than in the prior decade, the markets do not appear to have universally discounted a large conflict unfolding in other asset classes like energy assets or defense stocks. We do hope the markets are right on this call!
- Due to inflationary pressures and aging gold mines, the all in sustainable cost has moved up sharply, from the $1,500s to the low $2,000s per ounce.
In summary, we believe gold belongs in all multi-asset portfolios with the sizing varying based on the diversity of other portfolio holdings. We believe that the recent 25-year performance is not a bug but rather the logical conclusion of the end of an era. Simply, we have used our currency (bonds) as a means to pay for additional spending above income for our consumer and our government which lenders, those with large current account surpluses with us, have funded through suppressing their own consumers.
China, Non-US Assets & Emerging Market, What Now?
On September 24, 2024, China announced a major stimulus package, its largest since the pandemic, pledging to ramp up fiscal support. The package is aimed at addressing the country’s slowing economic growth and declining consumer confidence. Key measures include:
- Cuts to key lending rates and the reserve requirement ratio.
- Support for the equity markets, featuring a liquidity facility to assist companies and shareholders with stock buybacks.
- Direct aid for unemployed graduates and the introduction of a monthly allowance for children.
- Bond issuance to stimulate consumption, including subsidies for replacing consumer goods and upgrading business equipment.
- Housing market support, with the government purchasing housing supply through loans provided to developers, commercial banks and re-lending institutions.
Simply, in our view, these measures suggest the government has revealed the level of economic pain it will face before capitulating.
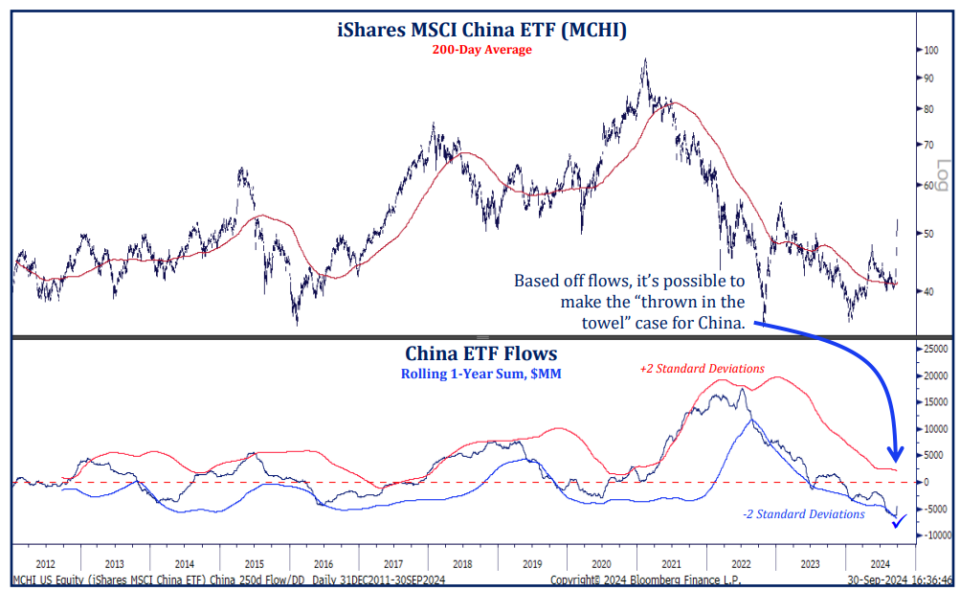
Following regulatory changes in 2021, China-focused ETFs have seen consistent outflows as emerging markets (EM) funds shift away from the country. Before the stimulus announcement, Chinese stocks had been very out of favor. Gross and net allocations to Chinese equities had dropped to five-year lows and still remain below the five-year average, despite a recent increase in short covering. The positioning leading up to the announcements and the scale of the change in tone of government regulators created one of the largest one-week rallies for a large country market on record.
Source: Strategas
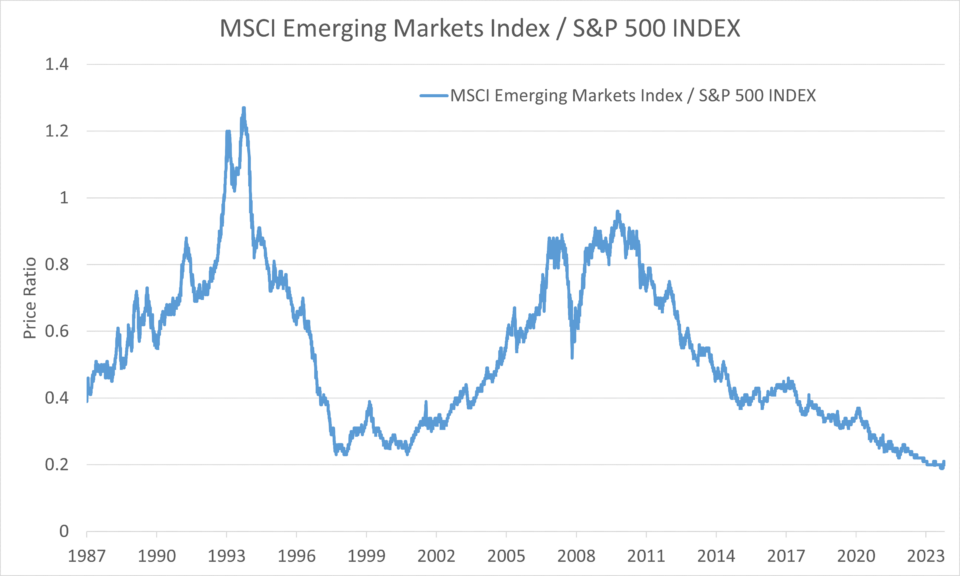
We are not sure what happens next in China or for the rest of the emerging markets. However, the chart below caught our attention, which shows that the average investor has been served very well by being long the SP500’s largest companies and underweighting EM. We question the sustainability of simply holding the S&P 500, as the starting point for valuations is much higher on a relative basis than at other periods and the record success of these companies is now drawing the attention / ire of regulators and politicians alike both in the United States and (especially) abroad. We also highlight that the dollar relative to other countries is seldom this expensive, so if you can travel, now is a great time to leave the United States and also a good time to invest in local currencies when purchasing their equity markets.
Source: Bloomberg

Is the US Consumer Out of Gas?
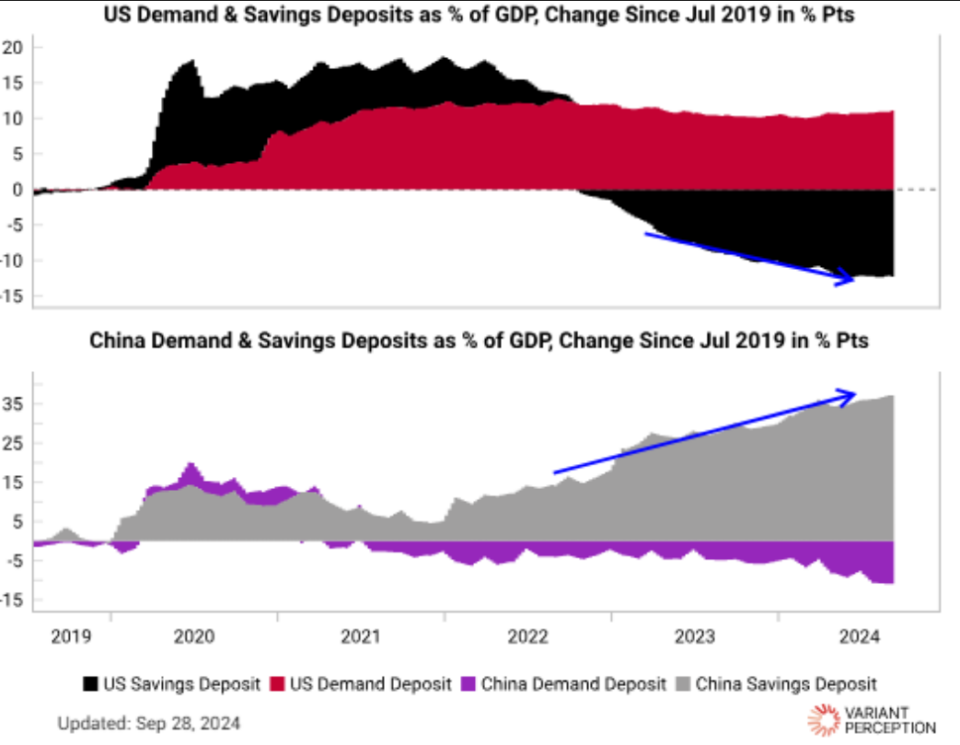
We have often said in forecasting the economy that only one thing really matters: the confidence of the consumer vs. the prior trend. We typically observe, with high confidence, the economic outlook will surprise on the positive; with low confidence, the economy will surprise on the downside. To spend, a consumer has three choices: to spend from current income, to spend from past income (savings), and to spend from future income (borrowing). What is unique about the US consumer is their willingness to spend on future income relative to the rest of the world.
A comparison of savings deposit trends in China and the U.S. shows a startling difference in trend. The Chinese consumer is cautious and has been saving, but the U.S. is the opposite. The BCA chart depicted below compares trend savings pre- and post-pandemic; the conclusion is that U.S. consumers are more willing to spend from savings than Europeans. The data itself doesn’t mean that consumer spending will implode; rather, it points out that during the last few years, the U.S. consumer has been more willing to spend out of savings or future earnings than other parts of the world. The savings rate in the U.S. is also at a low and has been trending lower since the 1970s, when the advent of the reserve currency status and Bretton Woods II allowed us to more efficiently run current account deficits or simply spend more than we make.
This optimism, or the willingness to spend from past savings, is the main reason why economic forecasters mistakenly believed the U.S. would enter an economic slowdown in 2024. We didn’t, and the surprise has been simply that U.S. consumers had more in their gas tank than expected.
Today, there is conflicting data on how much is left in the proverbial gas tank; on the plus side, the net worth (predominantly housing and stock market equity) is very high and supports continued spending. On the negative side, those without significant savings are showing considerable duress; 30-, 60-, and 90-day delinquencies are exploding in everything from RVs to motorcycles to subprime mortgages. This tells a pretty obvious story; those who have been fortunate to own long-duration assets or have significant savings have gotten richer, and those who are living paycheck to paycheck feel more stretched from the increase in everyday goods relative to wages. During the last three business cycles, wealthy consumers have curtailed spending dramatically, but not until the recession was clearly obvious.

Market
We are often asked what the market will do through year-end or if we should buy here; our advice is always the same: stay fully invested and actively rebalance to your target strategic allocation. We highlight, though, that the performance of the S&P 500 has been exceptional and that everyone agrees that it is an exceptional place to be. Next shown is the Fear and Greed index reported by CNN. It is an attempt to measure the amount of optimism in capital markets using various indicators.
In this report, https://papers.ssrn.com/sol3/papers.cfm?abstract_id=4912111, the authors use some sophisticated math and come to an obvious conclusion; yes, the absolute level and the direction of the index influence returns. We are struck that the index called a temporary bottom in the market this summer; might it call a temporary top before year-end?
CNN Fear & Greed Since Late 2023

Source: CNN
Central Bankers’ Jobs Are More Complicated & Difficult
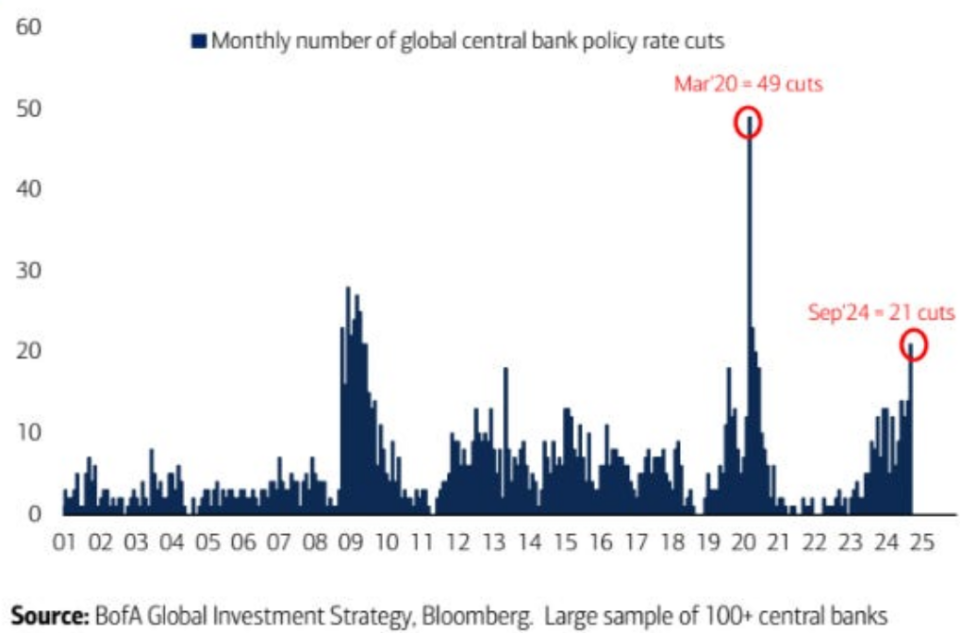
Central banks worldwide have been active at record rates. The chart puts the rate cuts in perspective; first, as a sheer number of cuts for various countries, this is aggressive, and it appears coordinated. In 2008, the logical driver was the U.S. housing crisis; in 2020, the COVID crisis; in 2024, it seems everyone wants to be dovish (just kidding).
With inflation rates falling due to the lagged effects of the COVID-19 jump, the central bankers believe there is an all-clear with inflation; this gives them the confidence to cut rates. We are still skeptical that this is the case and believe that at all times, the most significant risk to those holding risk assets of most types is an inflation surprise. Our nuanced point is this: while it’s more likely than not that inflation has eased; we do not have an all-clear on longer-term inflation.
If we are to have an inflation surprise in the coming months, the latitude of the Fed to pivot is less now that they and the capital markets have already positioned for deflation. In addition, as we mentioned, the US economy is benefiting from an optimistic consumer; it is possible that if inflation picks up, they will change their view; this creates a self-defeating loop of higher inflation expectations, slower growth, and higher rates. We appreciate that this is the worst case and is less likely. However, the odds of this type of stagflation situation have increased. Said another way, this type of aggressive action is unusual, and it narrows the “balance beam” of simple actions the Fed can choose in the future if there is either an inflation or economic surprise.
If EVERYONE is Cutting Rates, Then Why Are Long-Duration Rates Up?
Interestingly, despite all those forecasted cuts, longer-term rates have gone in the opposite direction, potentially signaling a few things:
- The market believes inflationary pressures are still alive; since the Fed cut inflationary views as expressed by 5-year forward rates have increased 11 bps.
- Recent economic news is generally more robust than the Fed signaled. For example, economic conditions, as measured by the Citi Economic Surprise Index, have moved from negative to positive territory.
- Despite the central bank’s positioning, we are in a bear market for longer-duration treasuries. Central bankers will have a more difficult job managing long-duration interest rates with a growing fiscal deficit, and that appears to be the signal from the bond market over the last couple of years.
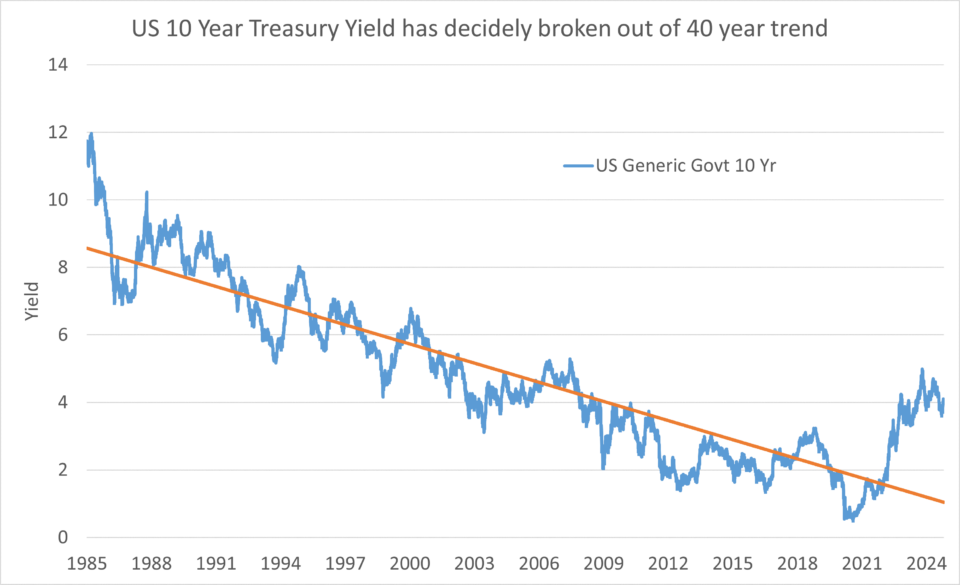
Economic forecasters have varying views on rates and fed policy. It appears the most obvious is that rates, which have fallen for the last 40 years, appear to be trending up. Below is a trend line for 10-year rates the U.S.; the chart indicates that during COVID, the expectations for long-term interest rates moved above the 40-year trend, potentially signaling the end of one of the longest-running bull markets of any asset. We pose the question: if enormous rate cuts worldwide aren’t enough to lower long-term rates, then this might be all we get for rate suppression or low rates this business cycle.
Where do we go from here? We suspect we have already made cycle lows and that long-duration rates average in the high 4s for the next business cycle.
Source: Bloomberg
Economy, Where Are We Now?
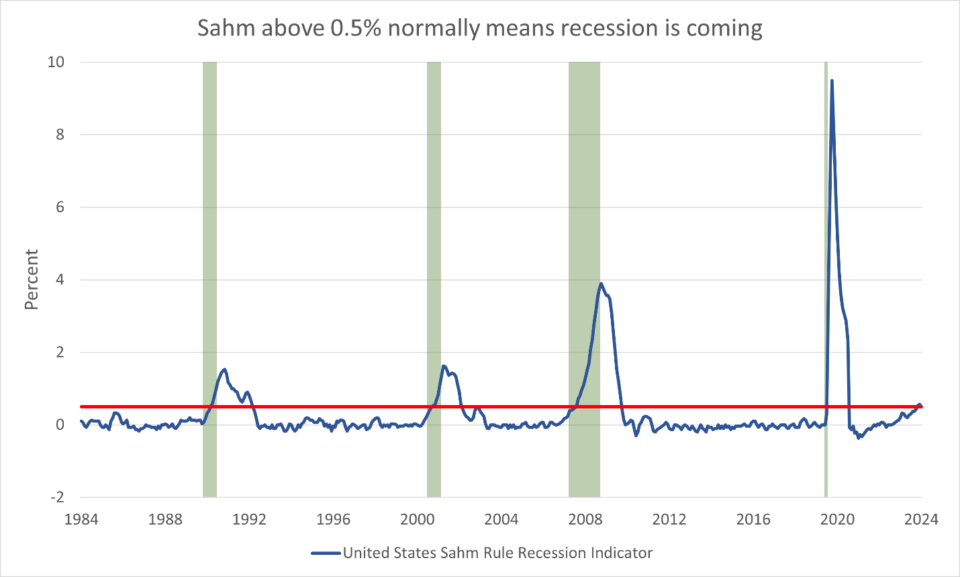
We still believe the odds of a mild (short and shallow?) recession are quite high; however, the exact timing is hard to predict. Our best guess is that we will get increasing signals of a recession throughout 2025 as the fiscal impulse slows, the consumer begins to slow further, and the obvious slowdown in construction impacts job growth. We admit, though, that recent data such as nonfarm payrolls do run counter to this trend.
Our confidence is based on a few things: most sentiment or survey data is soft and continues to soften. The Sahm rule has triggered. This is a simple momentum measure of unemployment shown below. Typically, this indicator signals to policymakers to increase fiscal spending and be more aggressive with Fed policy; the increase in the Sahm during prior recessions led to larger and larger fiscal spending and dramatic rate cuts; today, we have already had large fiscal spending and have sharply cut rates. Across the board, anemic capital spending, as highlighted last quarter, is typically a harbinger of economic conditions and is the best measure of CEO confidence.
If we are wrong, it is likely due to the resilience of the high-end , which has its largest wealth on record due to the stock market and home appreciation. The false cries for a recession in 2023 were largely wrong due to the resilience of the US consumer; we are skeptical that this will be the case next year. In addition, some have pointed to the sharp cut in interest rates. The key 5- and 10-year lending rates have barely budged, so while short-duration borrowers like revolving credit will see some reprieve, the current move from the Fed will not spur a significant resurgence in spending on long-duration assets, the hallmark of a recovery.
Source: Bloomberg
Was it too Crowded in Technology stocks?
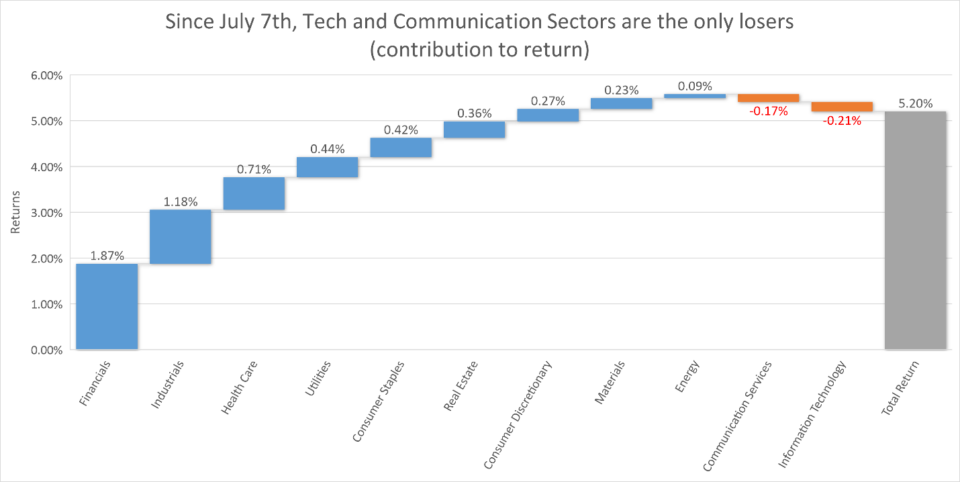
There has been enormous attention paid to central bank policies and what JPOW will do next, so we wrote a paper on it. What hasn’t gotten enough attention is that since the writing of our last letter in mid-July, when we just questioned the size of the crowd pushing into technology and that potentially the excess returns were near a peak, the rest of the market is up while technology is the only sector in the red.
Since then, stocks like NVDA have continued to perform well, but MSFT, TSLA, GOOGL, AMZN, META, and AAPL are collectively about flat. We suspect that the incredibly large investments in AI are depressing long-term cash flow projections and shareholders are questioning whether those investments in data centers will have just good returns and not as exceptional as once hoped. James Covello, Goldman Sachs, head of research and a former semiconductor analyst, sums up the concerns well: “Historically, most technological transformations, especially those with transformative significance, have replaced very expensive solutions with very cheap solutions. Replacing low-wage jobs with extremely expensive technology is going in the opposite direction.” We highlighted our beliefs in a paper that enablers like NVDA and the semiconductor companies were the likely winners but expensive and were skeptical of the companies that benefited from the technology as the costs have been very high so far. As a result, we agree with the market’s recent moves.
Source: Bloomberg
TwinFocus Key Positioning:
- We continue to be skeptical of Private Equity as an asset class and are highly selective on private / structured credit. We wrote a paper on this topic…the message is simple: returns will be lower going forward due to the high starting point on valuations. The same holds true on public equities! Moody’s also put up a damning summary, which seems to point to Private Equity taking more credit risk than the broader market. We highlight this quote as particularly outspoken for an outfit like Moody’s, which likes to keep its comments very vanilla until it’s obvious: “We are seeing this trend toward greater use of PIK loans and nonaccruals (in private equity, private credit, and LBOs) to an even greater extent in the BSL (broadly syndicated loan) market.“
- We believe all diversified portfolios should have some exposure to gold as an asset class.
- We continue to believe that investors should stay short to get long rates. In other words, longer duration rates likely move higher, keeping returns at or below-stated rates.
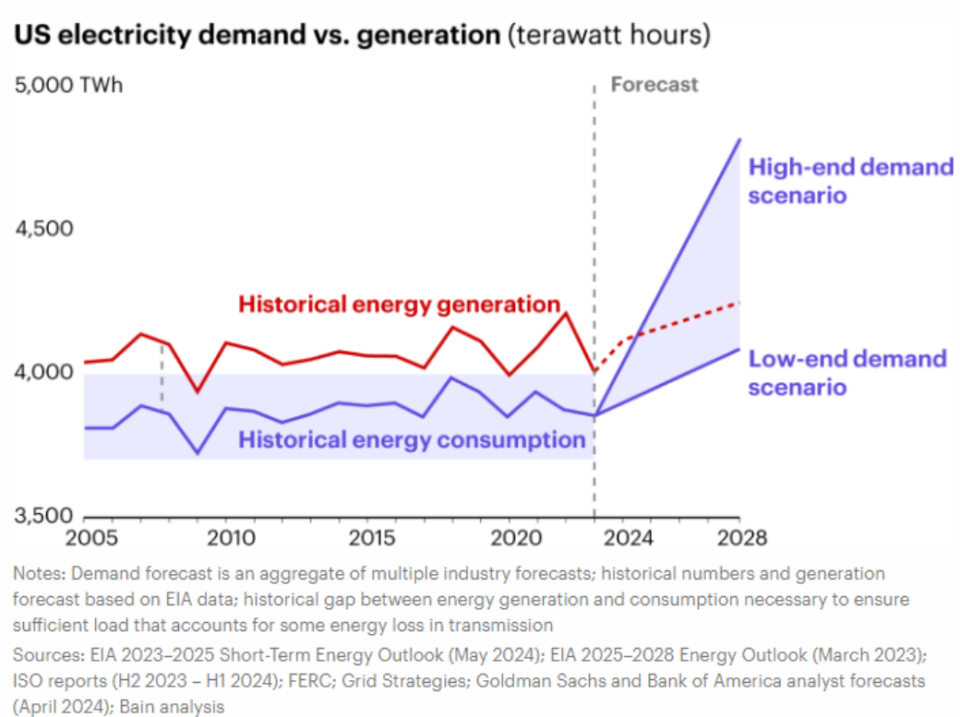
- We continue to like our plays on the picks and shovel winners from the AI boom; this chart highlights the staggering need for electricity supply in the United States and supports our position in both commodities and utilities that benefit from the mismatch in electric demand and supply.
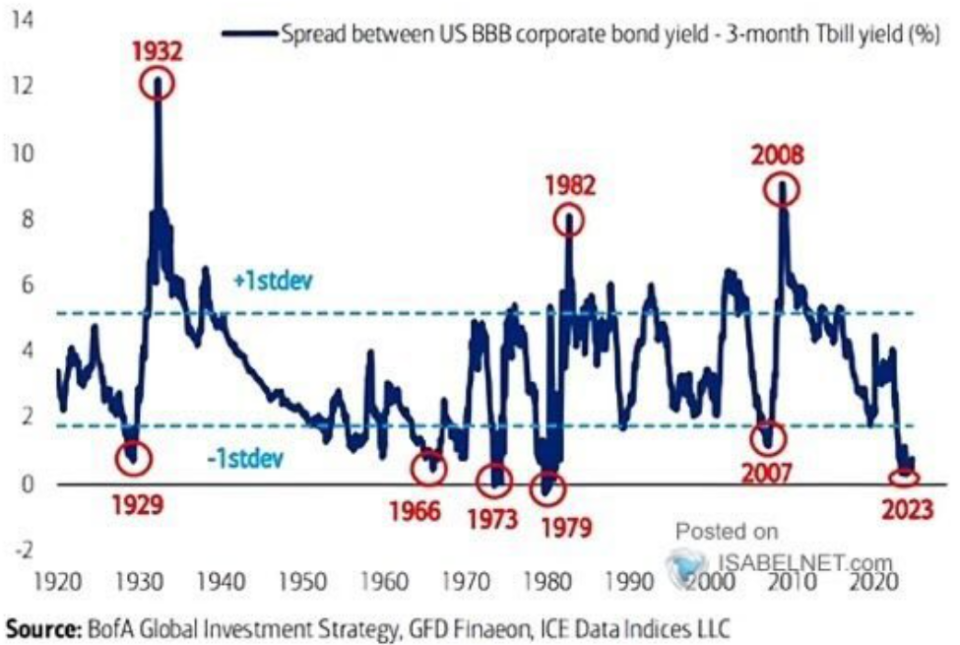
- We have been early in calling the peak in credit globally. However, we still believe that with spreads near generational lows, investors are better served in other asset classes. The CLO asset classes offer better risk-adjusted returns for investors seeking yield than investment grade or high yield.
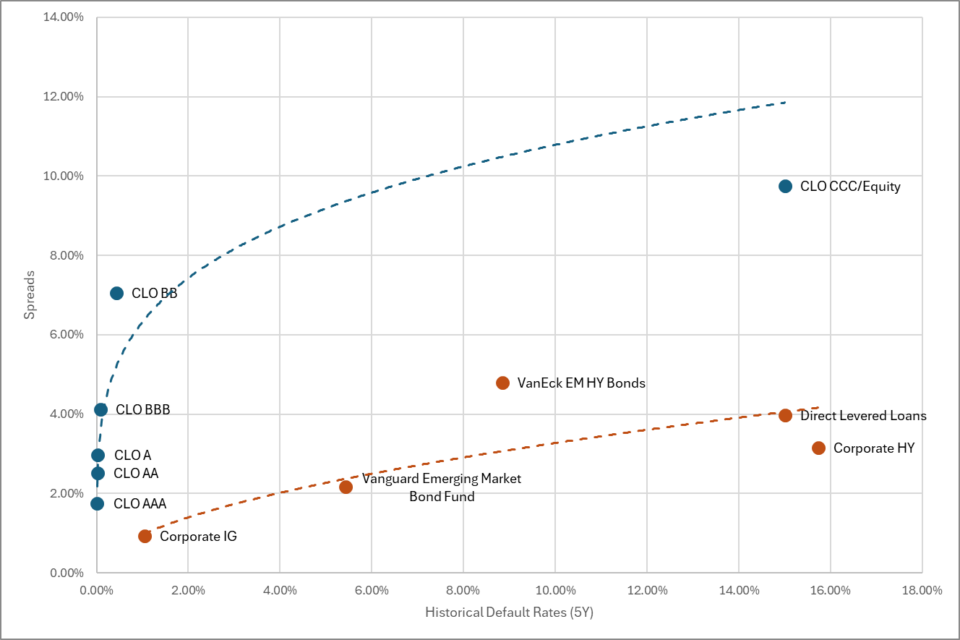 Source Bloomberg and Morningstar
- Taxes are in vogue. We are very excited about some novel approaches to funding strategies with appreciated securities, thereby delaying eventual tax payments. We also believe that, like opportunity zones during the Trump era, the tax breaks given to investors in alternative energy have the potential to have very strong after-tax returns.
Summary
We are a bit more concerned about a recession than most, driven by our view that consumer spending as a share of GDP is near a peak for this cycle. We suspect investors have become overconfident in a central bank’s ability to manage economic conditions, and as a result, investors should prepare for more volatility in rates and be cautious about longer-duration bonds. We don’t believe gold is a bug of the system, but rather, a prudent allocation to gold makes sense as part of a broader portfolio allocation. While we have been consistent proponents of the liquidity premium and the advantages of investing in illiquid assets, we are far more skeptical today and now suspect that returns will underperform investors’ expectations. After a fantastic multidecade run in US equities and the dollar vs. the rest of the world, we believe now is a great time to rebalance strategic weights in equities globally.


